Key insights (mayoral elections)
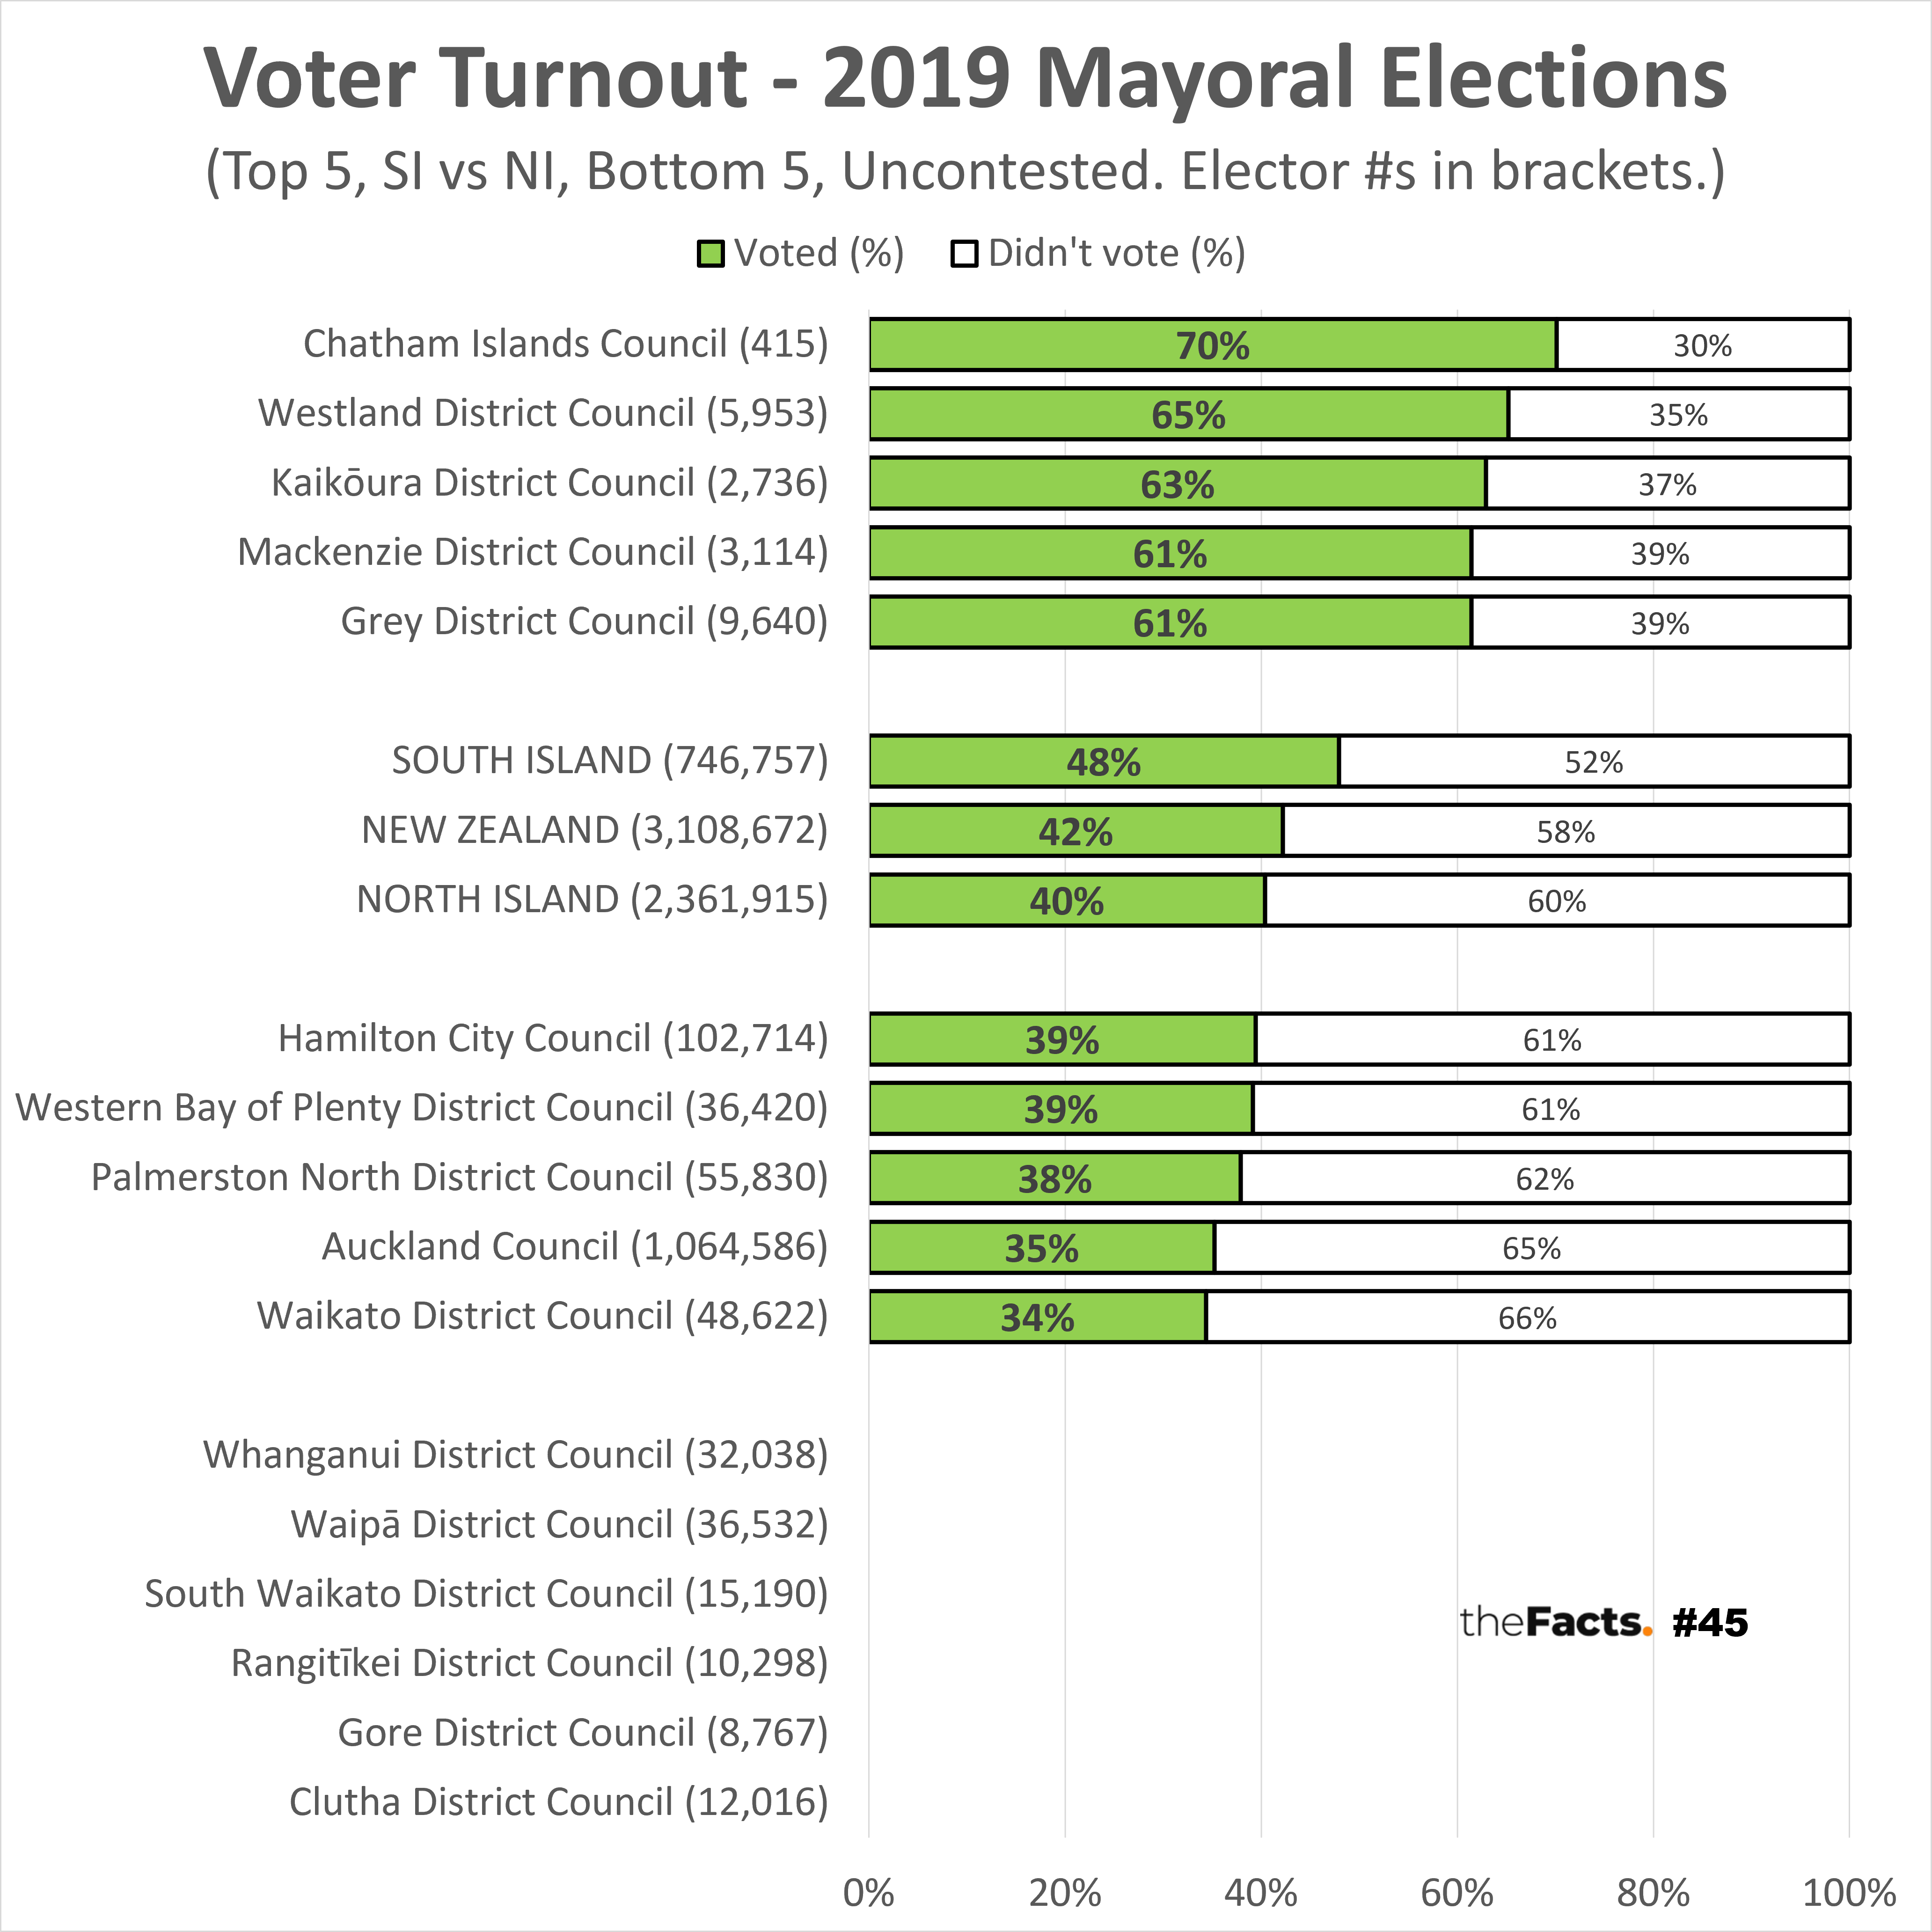
- The top 5 voter turnouts, and the only ones >60%, were all South Island Councils
- The bottom 5 voter turnouts, and the only ones <40%, were all North Island Councils
- Easily our biggest local authority at >1 million electors (eligible voters), Auckland came in second to last with just 35.2% voter turnout in 2019
- The lowest voter turnout, and only one <35%, was Waikato District Council at 34.4%
- The highest voter turnout, and only one >70%, was Chatham Islands Council at 70.1%
- In total, South Island Councils had a 19% higher voter turnout than North Island Councils (47.9% vs 40.4%)
- The total local election voter turnout for New Zealand was 42.2% (and the median by local authority was 50.2%)
- At the 2020 general election, voter turnout was 81.5% – almost twice as high as for local elections
- 6 mayoral elections were uncontested in 2019 due to only 1 candidate
…
Key question
- Will you vote in your local elections this year?
…
Have your say
…
Full data
Please contact us if you would like the full analysis.
…
Notes
- All publicly available data has been included.
- We chose to show mayoral election voter turnout because:
- Mayoral elections carry higher public and media interest than other elected positions
- The voter turnout %s for council positions is very similar – also at 42% in 2019
- All numbers are provisional and subject to revision.
Thank you to the Factors who helped pull this together.
…
Sources
- Local Authority Election Statistics https://www.dia.govt.nz/Services-Local-Elections-Local-Authority-Election-Statistics-2019#three
- General Election Voter Turnout Statistics https://elections.nz/democracy-in-nz/historical-events/2020-general-election-and-referendums/voter-turnout-statistics-for-the-2020-general-election/
Data published by The Department of Internal Affairs, and the Electoral Commission
(c) Crown Copyright
Licensed for use under the creative commons attribution licence (BY) 4.0
…
Did we make a mistake, or have you got smarter data? Let us know.