KEY INSIGHTS
- Health is the #2 voter issue this election, behind only Cost of Living/Inflation, according to both Ipsos and Curia polling.
- There are 5 Health Targets. These are agreed health KPIs between different parties, with data going back to 2015/16.
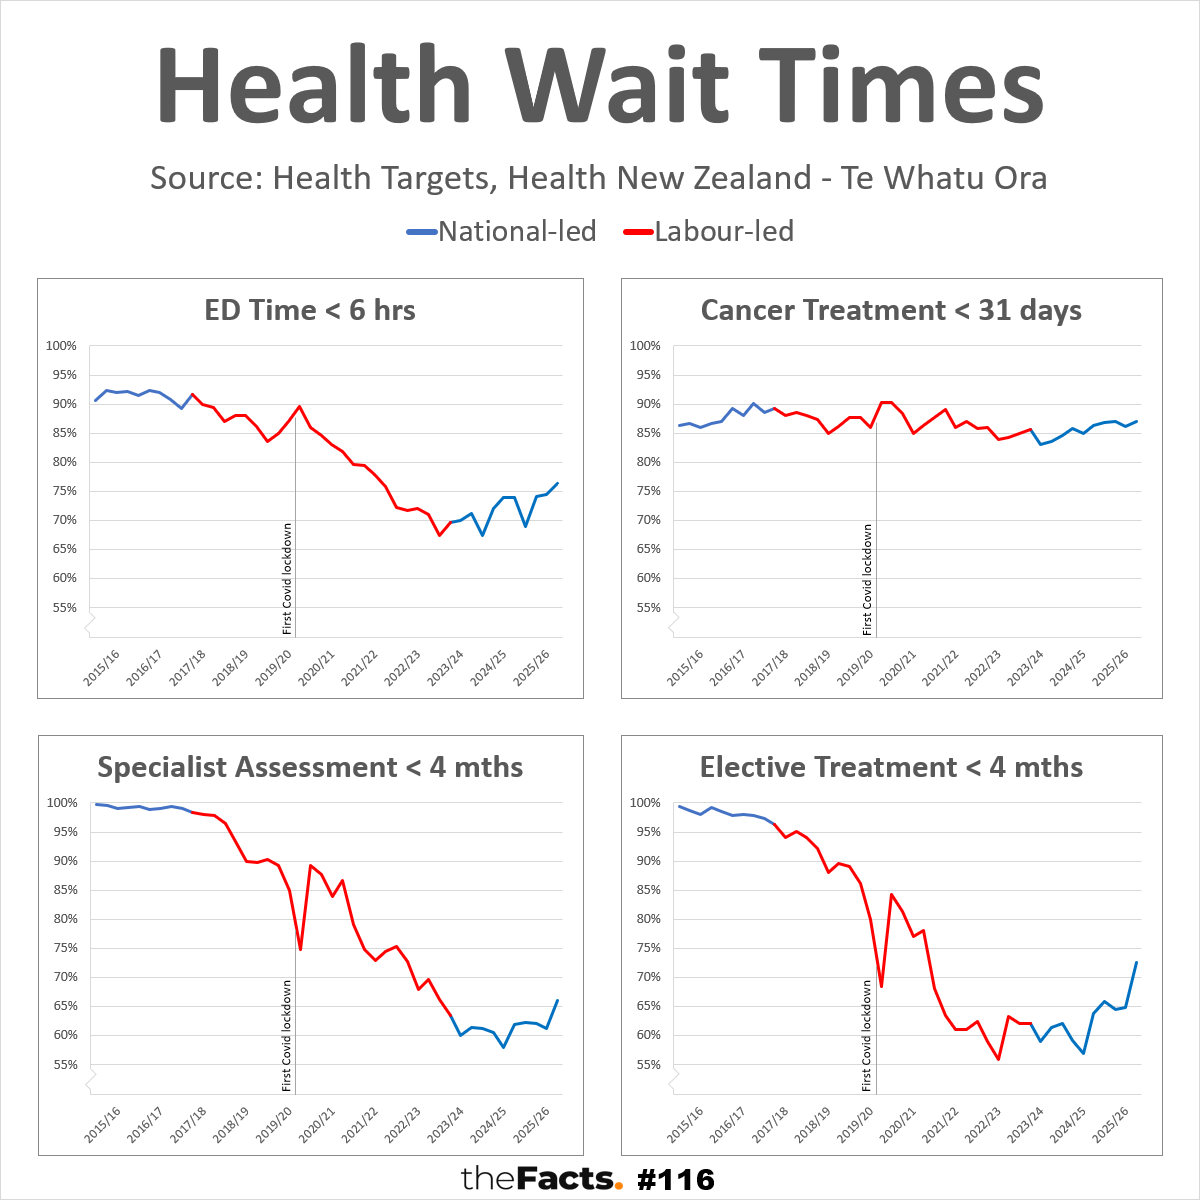
- 4 of the 5 Health Targets concern wait times, as shown in our graphs.
- The 5th measures Childhood Immunisation, but only for 24-month-year-olds. See KPI.nz for a more comprehensive analysis across all age groups and years.
- All 4 wait time measures were relatively high and stable under the 2015–2017 National-led Government.
- 3 of the 4 rapidly deteriorated under the 2017–2023 Labour-led Governments, and before the first Covid lockdown:
- ED Times dropped from the low 90s to under 70% (now back over 75%)
- Specialist Assessments dropped from high 90s to under 65%, and then further again to 60% (now back over 65%)
- Elective Treatments dropped from mid 90s to as low as 55% (now back over 70%)
(Cancer Treatments remained relatively stable for over a decade, and through Covid, further supporting the argument that our Covid response didn’t have to come at the expense of other health services)
- The rapid decline of those 3 Health Targets under Labour has been halted, and is now improving again under the Coalition. Cancer Treatments have also improved (as has Childhood Immunisation)
1 KEY QUESTION
- Why do most voters believe Labour is the best at Health when the key performance indicators suggest the opposite?
(Ipsos polling = 38% Labour, 21% National. Curia polling = 34% Labour, 25% National).
…
HAVE YOUR SAY
- Vote




…
FULL DATA ANALYSIS
Please contact us if you would like the full data set and research.
…
SOURCE:
Health Targets = https://www.healthnz.govt.nz/about-us/what-we-do/planning-and-performance/health-targets
Data published by Health New Zealand – Te Whatu Ora
(c) Crown Copyright
Licensed for use under the creative commons attribution licence (BY) 4.0
…
ADDITIONAL NOTES:
- Latest data: Q4 2025/26 (April-June 2026), released 23 September 2026.
- There was a single 2014/15 Q2 figure for Cancer Treatments only, which we have omitted due to having no data for the other 3 quarters, or for the other 3 measures, from that year.
- We have started the graph from Q1 2015/16 when full data records began.
- To obtain all data available, you need to go through all of the older quarterly reports. It will be faster to contact us if you would like the full data set and research.
- The full description and measures for the 4 targets are:
- Shorter stays in emergency departments
95% of patients to be admitted, discharged or transferred from an emergency department within 6 hours. - Faster cancer treatment
90% of patients to receive cancer management within 31 days of the decision to treat. - Shorter wait times for first specialist assessment
95% of patients wait less than 4 months for a first specialist assessment. - Shorter wait times for elective treatment
95% of patients wait less than 4 months for elective treatment.
- Shorter stays in emergency departments
- Shortened measure descriptions are used in the graph to improve accessibility, engagement, and comprehension.
- The 90% and 95% formulas have not been included on the graphs which are already very busy, we felt it less material for that visual and would add confusion, and have included it here in the notes instead.
- Blue and red line colours represent each government based on the colour of the lead party.
- New Zealand’s first COVID-19 lockdown began at 11:59 pm on Wednesday, 25 March 2020. As such, the “First Covid Lockdown” lines have been placed between Q1 (January-March) and Q2 (April-June)
- Each vertical axis starts at 55% for consistency, and to highlight detail and improve understanding. Not starting a vertical axis at 0% is common in health data reporting, including the New Zealand Medical Journal, where shifts are often small, but can have significant impact on health outcomes and costs for the country. A scale from 0-100% hides these insights.
- The graphs show historical performance by government, not proof that government policy alone caused the changes. There are many other factors that may also influence results.
- All numbers are provisional and subject to revision.
Thank you to the Factors who helped pull this together.
…
Did we make a mistake, or have you got smarter data? Let us know.