KEY INSIGHTS
- 88,383 written submissions were received for the Water Services Entity Bill
- 680 (0.8%) supported the Bill
- 160 (0.2%) were coded as neutral
- 3,790 (4.4%) opposed the Bill and had their written submissions accepted
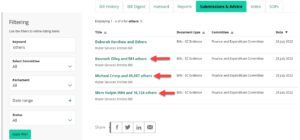
- 81,794 (94.6%) opposed the Bill and their written form submissions were not counted in the sentiment totals
- In total, 85,584 (99.0%) of all written submissions opposed the Bill.
- If omitting the form submissions, 81.9% opposed the bill.
- 1,959 submissions were not coded either way. See notes.
- “A significant number” of those 88,383 written submissions “requested to be heard orally” but this number was not made publically available.
- 227 (0.3%) of those 88,383 written submissions were offered and gave oral submissions.
- 88,052 (99.6%) of those 88,383 written submissions were from individual submitters. We do not know how many individuals were offered oral submissions, but have asked several times.
…
KEY QUESTIONS
- Is the Government listening to the people?
- Is the written submission process working?
- Is the oral submission process working?
- Is the select committee process working?
- Will you put in a submission for the next two Three Waters’ Bills closing in two days’ time?
…
Have your say
…
Other notes:
- The Departmental Report says that there were 81,794 form submissions. We found 81,795. We’ve used their number.

- The Departmental Report explains the 1,959 written submissions that were not coded as supporting, neutral, or opposing the BIll by saying “Submissions considered as unclear either contained specific technical suggestions, or alternatively did not contain information relating to the Water Services Entities Bill.” We did not include these in the pie graph because then we wouldn’t get a sentiment breakdown that added up to 100%.
- We have asked several questions to better understand:
- Why form submissions were treated the way they were, and what weighting they were given
- Whether polling research was considered in the process
- What data was used to assess New Zealand’s a) drinking tap water quality and b) sewerage system quality, versus comparable nations, e.g. OECD
- Additional notes from Internal Affairs can be found in the data source pages below.
- All numbers are provisional and subject to revision.
Thank you to the Factors who helped pull this together.
…
SOURCE:
Data published by Internal Affairs
(c) Crown Copyright
Licensed for use under the creative commons attribution licence (BY) 4.0
…
Did we make a mistake, or have you got smarter data? Let us know.


