KEY INSIGHTS
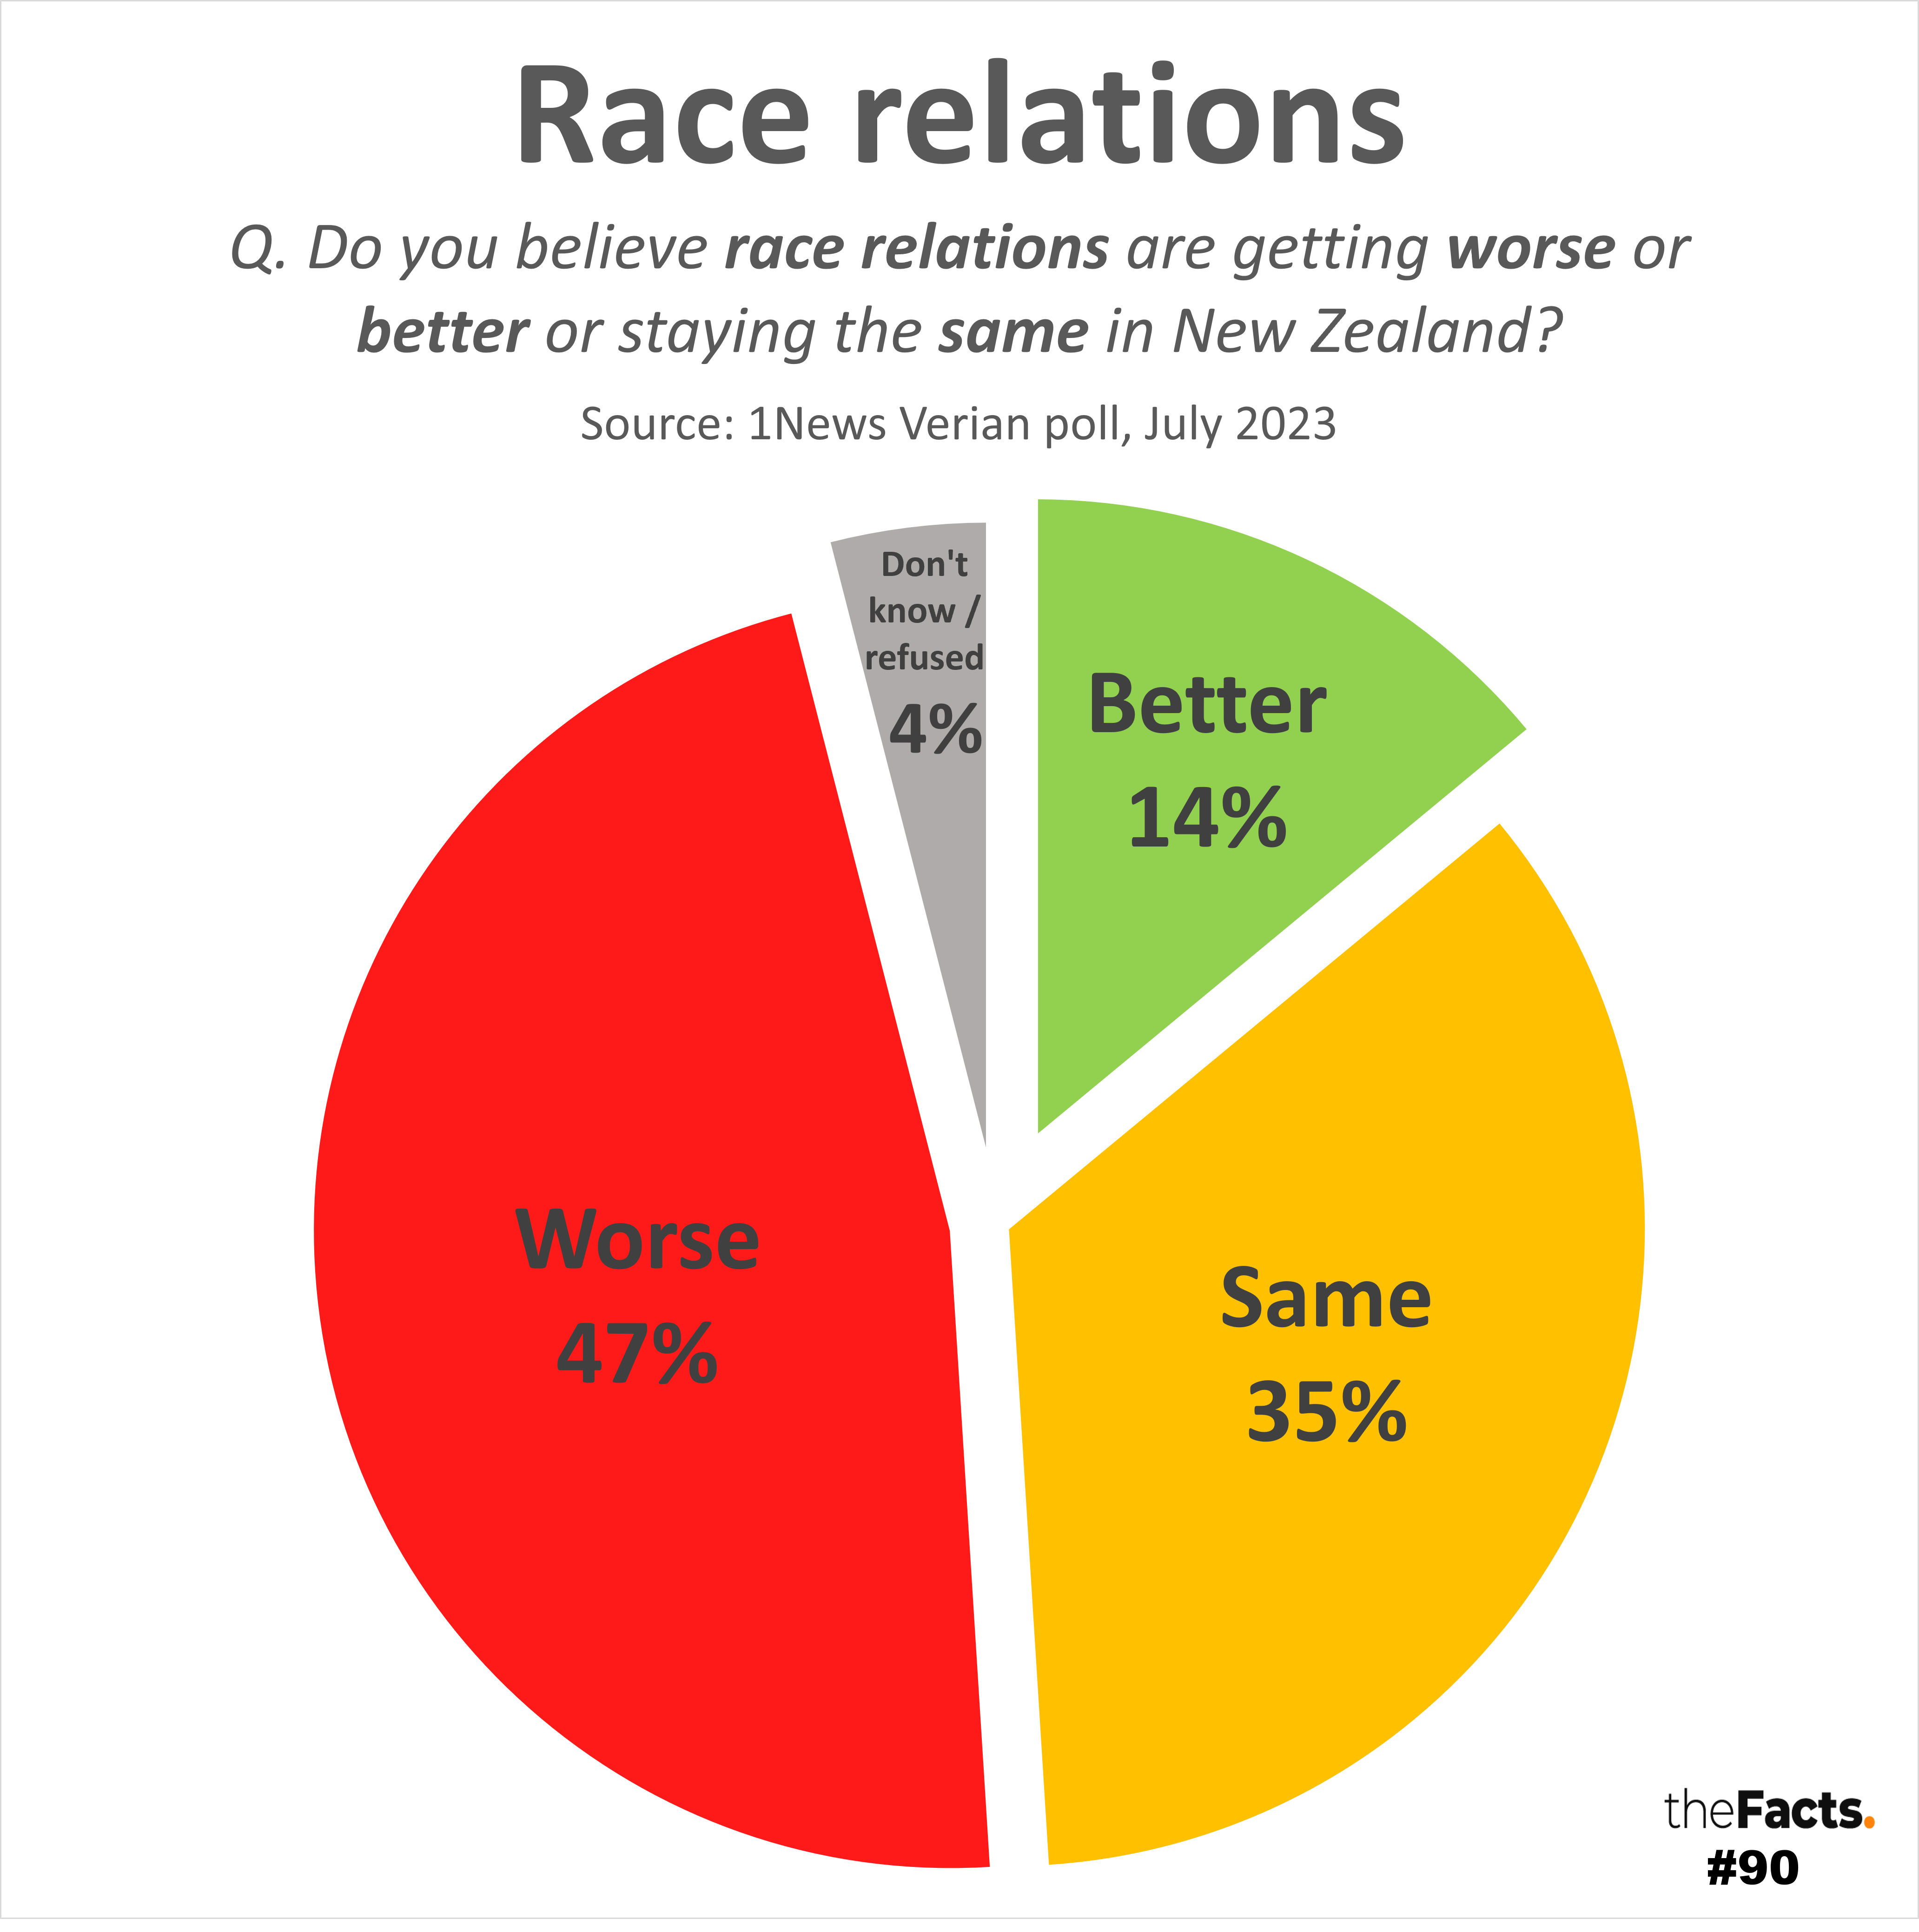
In the 1News Verian poll for July 2023:
- 47% = race relations are getting worse
- 35% = race relations are staying the same
- 14% = race relations are getting better
- 4% = don’t know/refused to say
KEY QUESTIONS
1. How big an issue is this for New Zealand right now?
2. Is it ‘race-baiting,’ ‘race politics,’ and a ‘political football’ as referenced in the accompanying news stories, or is it a ‘social issue’?
3. How do we improve race relations?
…
HAVE YOUR SAY

![]()
…
FULL DATA ANALYSIS
Please contact us if you would like the full data set and research, or visit https://www.1news.co.nz/2023/07/21/poll-country-divided-on-race-relations/. (The 1News TV coverage from 20:47 on https://www.tvnz.co.nz/shows/one-news-at-6pm/episodes/s2023-e201 is only available for 2 more days at the time of posting this fact.)
…
KEY NOTES
We don’t know for sure how important an issue this is for New Zealand because:
- Of the two leading issues pollsters in New Zealand at the moment:
- IPSOS combines ‘Race relations / racism’ together, and these could be interpreted as two very different things by respondents, perhaps even antonyms at different ends of the same spectrum (one positive, one negative). Racism could also be interpreted in different ways too.
- Curia does not publish their full issues list that they test, and only asks for a top #1 issue which makes it hard for other issues to beat ‘Cost of Living’ right now which is easily the #1 issue overall. ‘Social unity / division’ has historically not been tested by them, was included a few months back, and we’re not sure if July’s poll included this or not. We will ask them and update this page.
- Neither polling company asks for how important each issue is, only a ranking, so an issue could be getting worse but going down the ranked issues list, or getting better but going up the issues list.
- Herald/Dynata conducted Social Unity/Division research in November 2022 which suggested that 2/3 of voters at that time (except 18-24 year-olds), believed New Zealand had become more divided. Social Unity/Division covers all areas of society, though, not just race.
…
OTHER NOTES
- We have shared all publicly available data.
- We bolded the words ‘race relations’, ‘worse’, ‘better’ and ‘same’ in the way we displayed the graph heading to help the reader more quickly understand the issue topic and options respondents were given.
- We decided to use an exploded pie graph today because:
- This question is about social unity/division and, given the results, we felt it appropriate to show a pie graph that was not united.
- The response options are very different. Better vs Worse are at opposite ends, but we don’t know if Same is good or bad, nor do we known where the 4% who ‘Don’t know / refused to say’ would have gone if probed.
- We’ve done a lot of basic pie graphs, including two last week, and felt this was visually more engaging.
- We shortened ‘Don’t know / refused to say’ to ‘Don’t know / refused’ and reduced the font size so that it could fit within the wedge like the other responses. We kept the ‘4%’ figure at the same font size as other wedges.
- We used a traffic light colour scheme today, which is commonly used to reflect good, same, bad results in research. Grey is also commonly used for did not answer.
- All numbers are provisional and subject to revision.
Thank you to the Factors who helped pull this together.
…
SOURCE:
(c) TVNZ
…
Did we make a mistake, or have you got smarter data? Let us know.