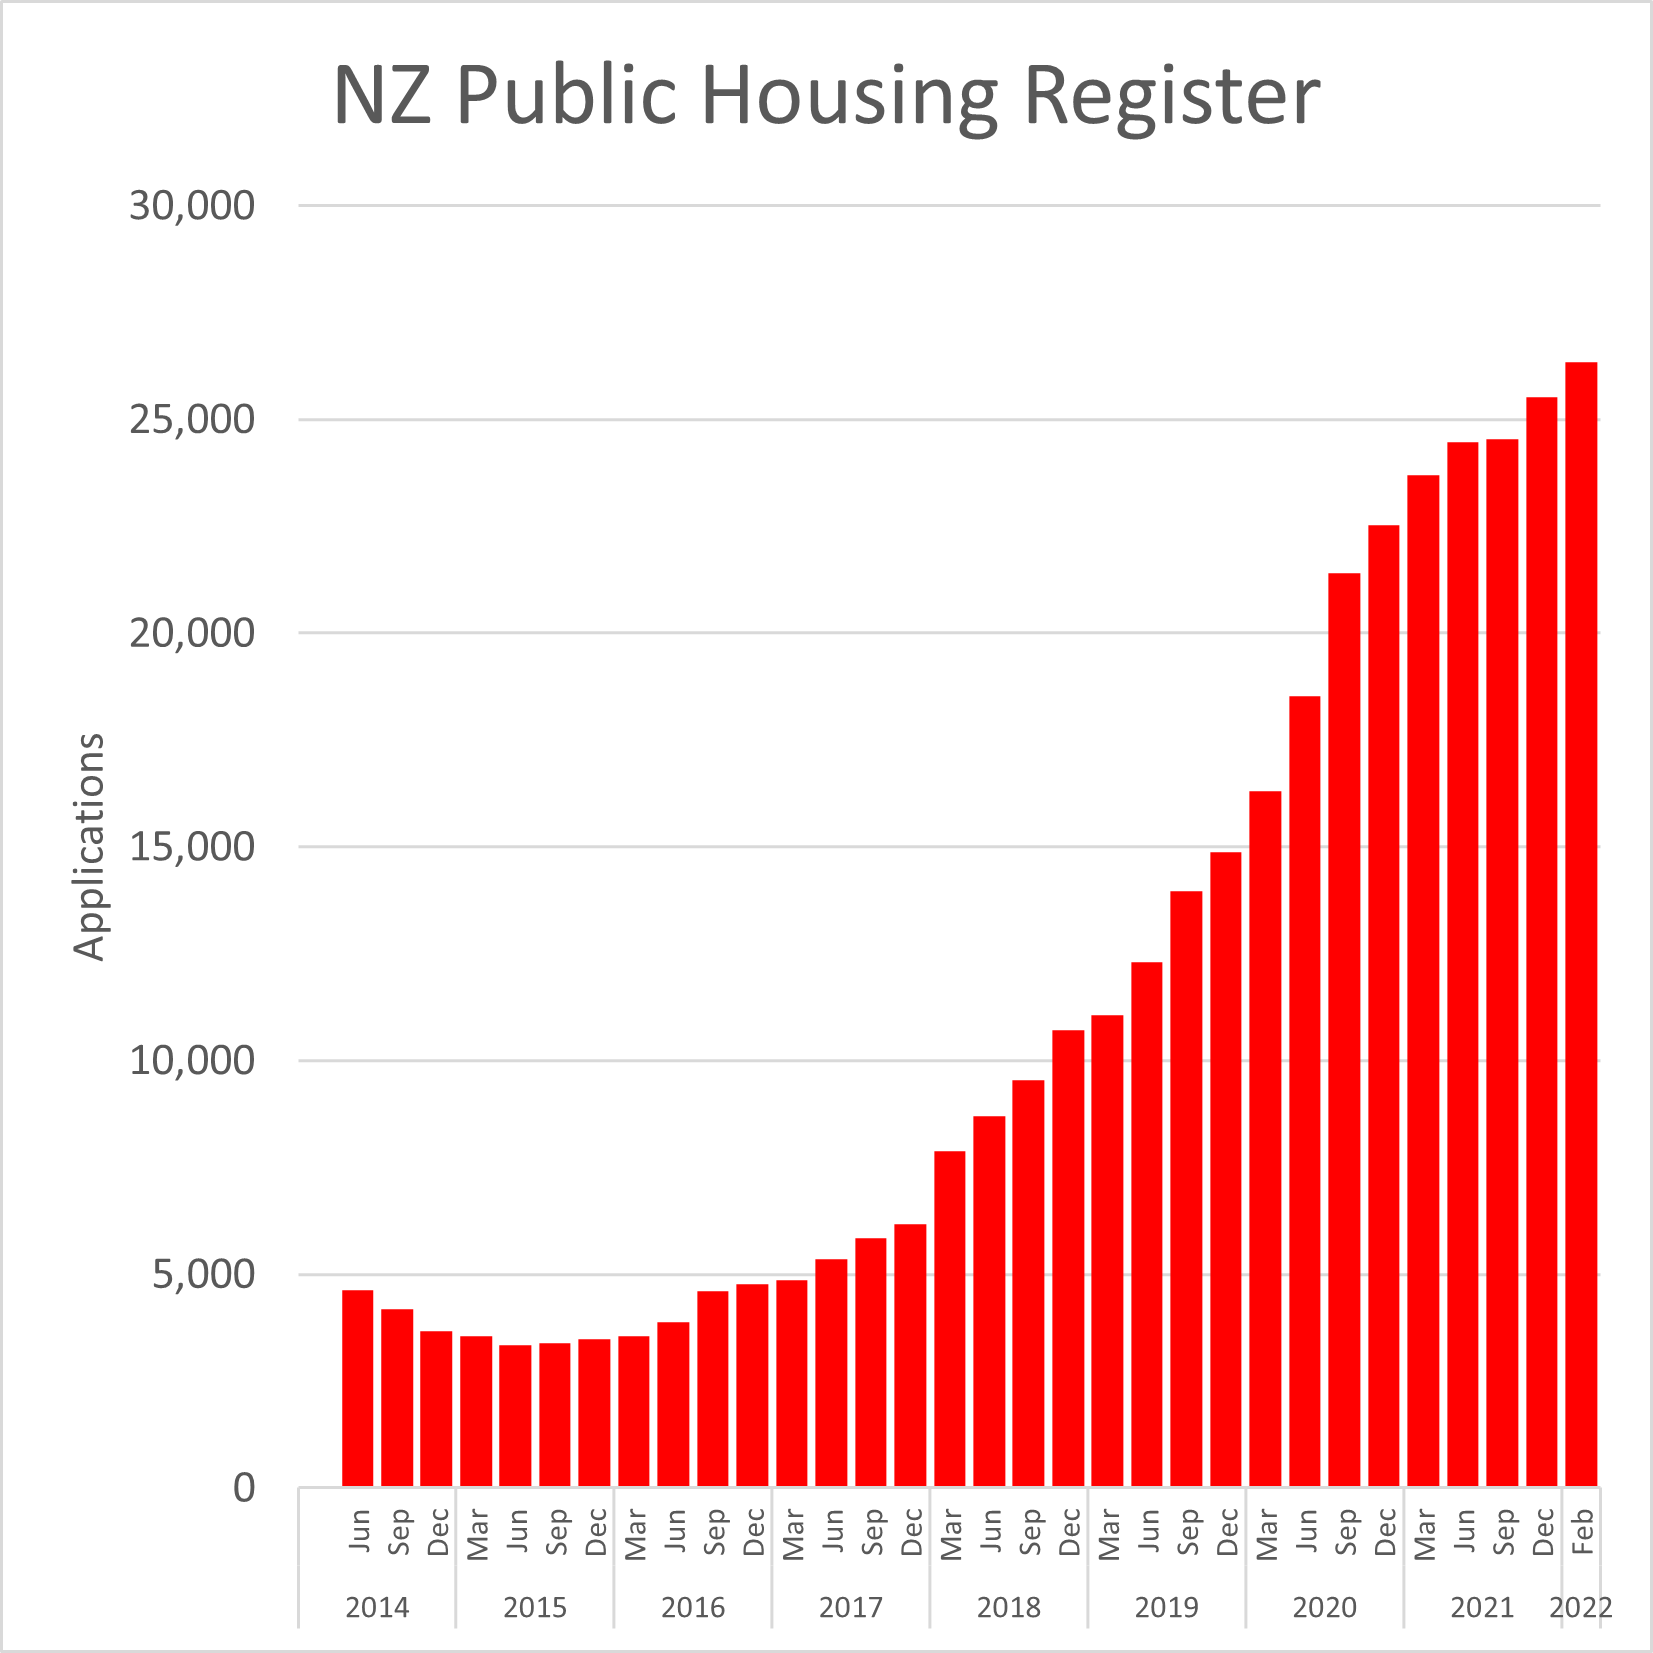
New Zealand public housing register by quarter:
| March | June | September | December | |
|---|---|---|---|---|
| 2014 | (no data) | 4,630 | 4,189 | 3,658 |
| 2015 | 3,562 | 3,352 | 3,399 | 3,476 |
| 2016 | 3,549 | 3,876 | 4,602 | 4,773 |
| 2017 | 4,866 | 5,352 | 5,844 | 6,180 |
| 2018 | 7,890 | 8,703 | 9,537 | 10,713 |
| 2019 | 11,067 | 12,309 | 13,965 | 14,868 |
| 2020 | 16,308 | 18,522 | 21,414 | 22,521 |
| 2021 | 23,688 | 24,474 | 24,546 | 25,527 |
| 2022 | 26,331 (Feb) |
- March 2017 = 4,866. February 2022 = 26,331. A 5.4x increase in less than 5 years.
- The three biggest increases occured in:
- March 2018 = +1,710 (+28%) in one quarter
- June 2020 = +2,214 (+14%) in one quarter
- September 2020 = +2,892 (+16%) in one quarter
- Public housing applications decreased for four consecutive quarters from June 2014 to September 2014, December 2014, March 2015, and June 2015
…
How do we solve this, New Zealand?
…
Have your say
…
NOTES:
- All available data from June 2014 to February 2022 has been shared in the graph above
- The quarterly March 2022 data has not been publicly released yet
- There was no data pre-dating June 2014 via the sources below
- “The Public Housing Register is a non-time bound list of all applicants eligible to be placed in Public Housing. Applicants complete a public
housing assessment which determines eligibility and priority for public housing against an agreed set of criteria, which is then used to assist the
public housing provider in matching to the most appropriate property.” - All numbers are provisional and subject to revision.
Thank you to the Factors who helped pull this together.
…
SOURCES:
September 2021 = https://www.msd.govt.nz/about-msd-and-our-work/publications-resources/statistics/housing/index.html
June 2014 to June 2021 = https://www.msd.govt.nz/about-msd-and-our-work/publications-resources/statistics/housing/archive/index.html
Data published by Ministry of Social Development
(c) Crown Copyright
Licensed for use under the creative commons attribution licence (BY) 4.0
…
Did we make a mistake, or have you got smarter data? Let us know.