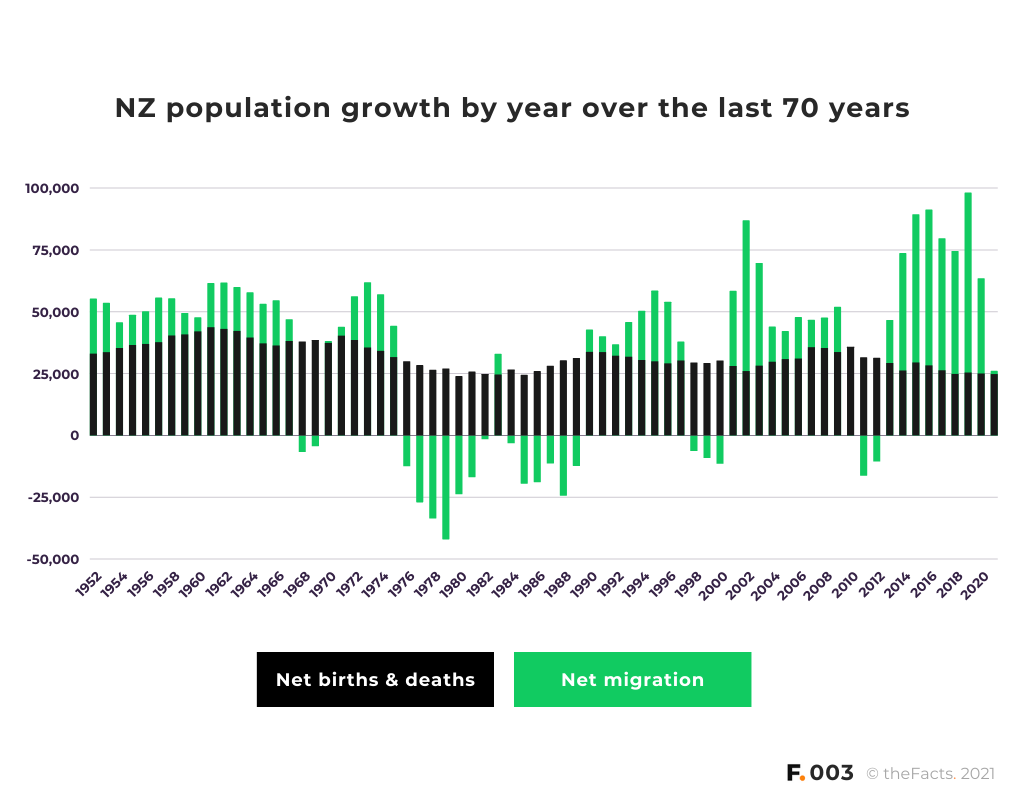
In the last 70 years in New Zealand:
Net births & deaths:
- averaged ~32,000 per year
- added 2.2 million more people to the population
Net migration:
- averaged 3,893 per year for 50 years from 1952 to 2001
- averaged 29,528 per year for 20 years from 2001 to 2020
- averaged 57,591 per year for 6 years (345,548 total) from 2014-2019 (pre-Covid)
- is <1,000 in 2021 to the end of September
- added 0.765 million (765k) more Kiwis to the population since 1952
Overall:
- Net births & deaths have added 3x more people than net migration in the last 70 years
- Net migration has added 2x more people than net births & deaths in recent years
…
Should New Zealand have a population strategy?
…
NOTES:
- The graph labels only show even years. The final column is 2021.
- 1952 was chosen as the graph start date because a) net birth & death data before this is significantly more difficult to obtain from Stats NZ, and b) 1952-2021 equates to a round 70-years of data.
- Stats NZ migration figures from 2020 are provisional and subject to revision.
- For the 2021 year, projections were made by dividing the January to September figures by 3/4 to get an annual total. Net births were 18,453 for January to September 2021, which is consistent with recent years. Net migration was only 979 for January to September 2021 due to border closures.
- “Net births & deaths” is also known as “Net births”, “Births less deaths”, and “Births minus deaths”. “Natural Increase” is the term currently preferred by Stats NZ.
- The data shown is a national aggregate. At an individual suburb, rural area, or town/city level, it is possible for deaths to exceed births in a year.
- New Zealand changed the way it measured net migration when it removed departure cards (the “intention-based” method) in November 2018 and replaced it with the passport/actual travel-based 12/16 approach (the “outcomes-based” method). A traveller is considered a migrant if they spend 12 of the following 16 months in New Zealand (migrant arrival) or out of New Zealand (migrant departure). There is an overlap of the years that both data methods were collated, and some variances due to both migrant arrivals and migrant departures being understated under the older intentions-based departure card method. Stats NZ recommends using the newer, more accurate, “outcome-based” system from 2001 onwards.
SOURCES:
https://www.stats.govt.nz/topics/births-and-deaths
(for all net births & deaths data from 1952 to 2020)
http://infoshare.stats.govt.nz/ – Table: Natural increase (Maori and total population) (Qrtly-Mar/Jun/Sep/Dec)
(for net birth & deaths from January to September 2021)
http://infoshare.stats.govt.nz/ – Table: Permanent & long-term migration key series (Annual-Dec)
(for net migration data from 1952 to 2017 using the departure card method)
https://www.stats.govt.nz/topics/migration
(for net migration data from 2000 to June 2021 using the “outcomes-based” method)
http://infoshare.stats.govt.nz/ – Table: Estimated migration by direction and country of citizenship, 12/16-month rule (Qrtly-Mar/Jun/Sep/Dec)
(for “outcomes-based” net migration up to September 2021)
https://www.stats.govt.nz/about-us/what-we-do/current-projects/migration-data-transformation-project/#faq
(for further explanation about migration measurement methods)
This work is based on/includes Stats NZ’s data which are licensed by Stats NZ for reuse under the Creative Commons Attribution 4.0 International licence.
…
Did we make a mistake, or have you got smarter data? Let us know.


