KEY NOTES
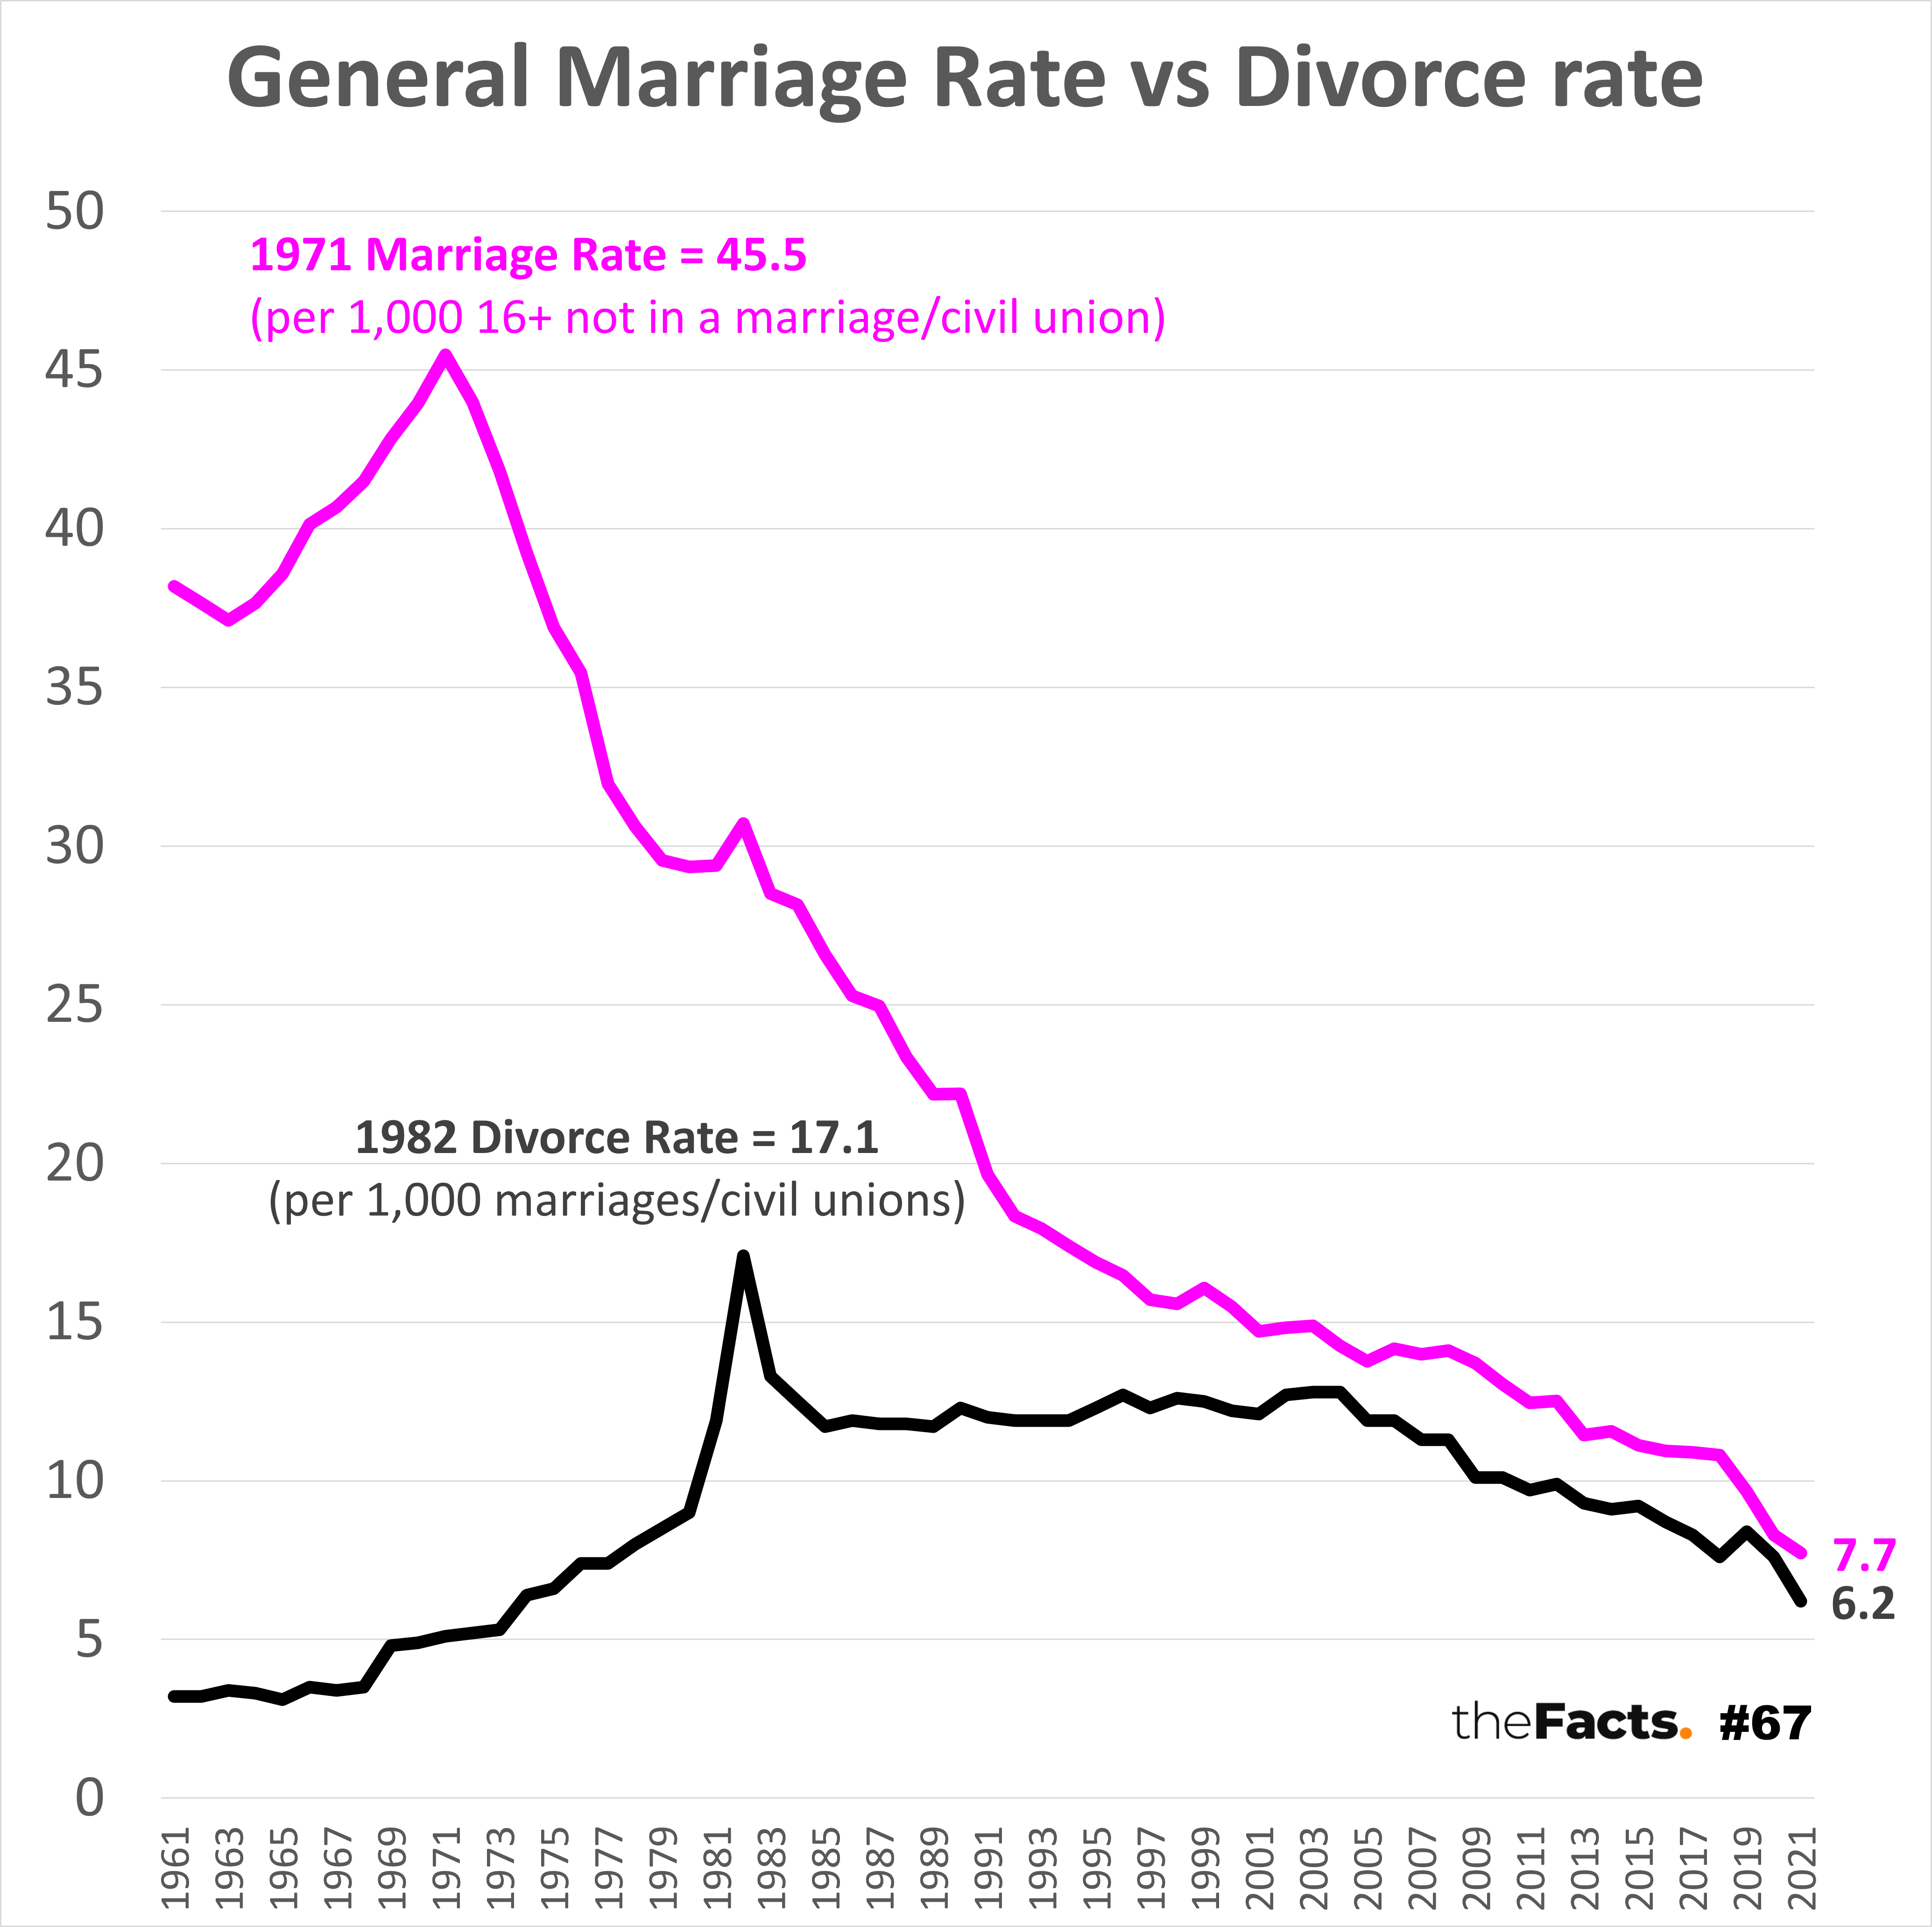
- The general marriage rate and divorce rate are measured slightly differently:
- General marriage rate = “Marriages and civil unions per 1,000 mean estimated population aged 16 years and over who are not-married or in a civil union (transfers to and from marriage or civil union are excluded).”
- Divorce rate = “Orders for dissolution of marriage and civil union granted in New Zealand per 1,000 estimated existing marriages and civil unions.”
As such, we can’t directly compare the numbers, but we can compare the trends, e.g. fewer New Zealanders are getting married, but also fewer married couples are getting divorced.
- There is also a crude marriage rate that takes the entire population into account, and you can do the same for divorces too, but that:
- Counts those under 16 years of age who can’t legally get married or have a civil union.
- Biases the numbers if you have significant changes in the proportion of young people in a population.
- Biases the numbers if there are significant changes in the percentage of the population who are married or in a civil union as you are dividing by those already married or in a civil union who can’t legally have another marriage/civil union at the same time.
- “Divorce in New Zealand was fundamentally altered when Parliament passed the Family Proceedings Act 1980, which came into force the following year. Until then the process had been concerned with finding out who was at fault. The new law focused instead on helping those in failing marriages and, from 2005, civil unions, to sort out their difficulties and move on.”
- From 2005 to 2021, civil unions only made up 1.1% of the total marriages and civil unions. In 2021 it was only 0.4%. This is in large part due to same-sex marriages becoming legal in 2013.
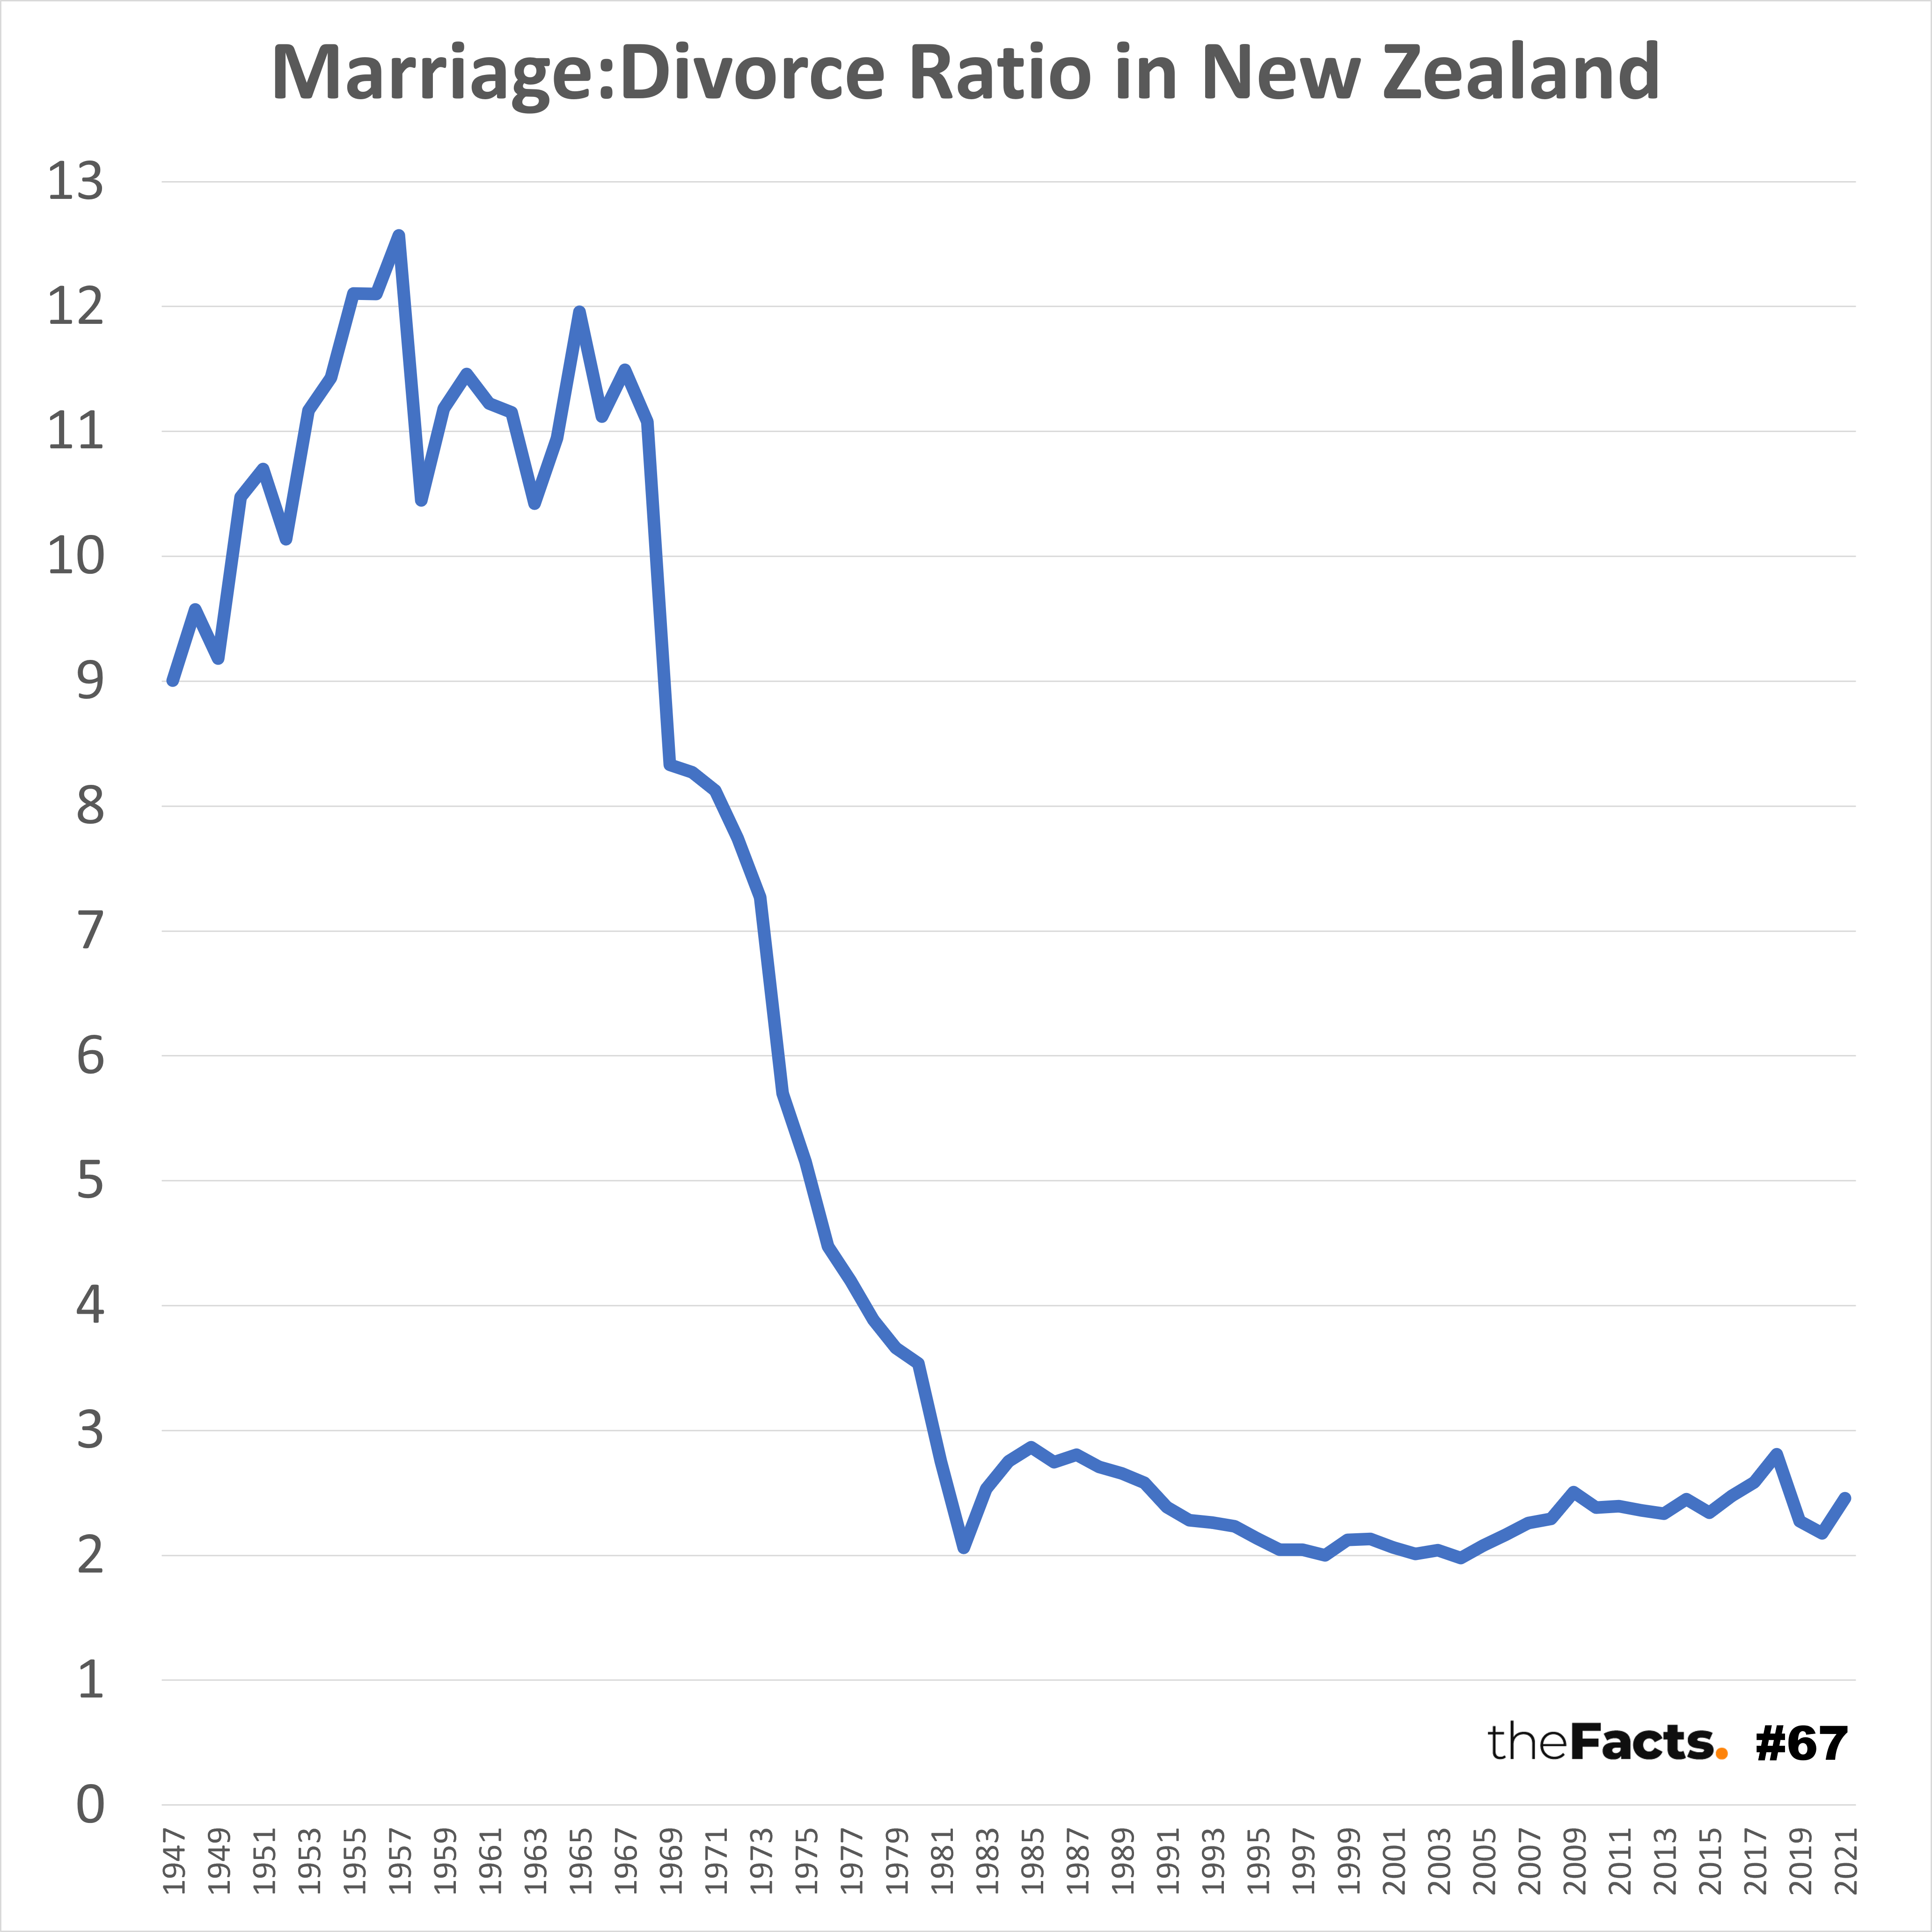
- In 2021, there were 2.5 marriages/civil unions for every divorce (15,657 / 6,372), and this ratio has averaged a fairly consistent 2.3 for the last 30 years (1991 to 2021).
- The full impacts of Covid restrictions on marriages, civil unions, and divorces will not be known for another few years since:
- Many weddings and civil unions were postponed due to lockdowns.
- You have to be living apart for two years or more before you can apply for a divorce. you have to be living apart for two years or more before you can apply for a divorce.
- The 2022 marriage, civil union, and divorce data will be released in May 2023 (and, likely, the 2023 data released in May 2024).
…
KEY QUESTION
- Do you think the decreasing marriage, civil union, and divorce rates are good, neutral, or bad for society?
…
Have your say
…
Other notes:
- All available data has been presented.
- For the General Marriage Rates: “Rates from 1991 onward are based on the resident population concept. Before 1991, rates are based on the de facto population concept. Vitals data (births, deaths and marriages) is based on date of registration (not date of occurrence).”
- Additional notes from Stats NZ can be found in the data source pages below.
- All numbers are provisional and subject to revision.
Thank you to the Factors who helped pull this together.
…
SOURCES:
- General marriage rate = https://infoshare.stats.govt.nz/ > Population > Marriage and Divorce Rates – DMR > General marriage rate, December years (total population) (Annual-Dec)
- Divorce rate = https://infoshare.stats.govt.nz/ > Population > Marriage and Divorce Rates – DMR > Divorce rate (total population) (Annual-Dec)
- Total marriage and civil union numbers = https://infoshare.stats.govt.nz/ > Population > Marriages Civil Unions and Divorces – VSM > First marriages, remarriages and total marriages (including civil unions) (Annual-Dec)
- Total divorce numbers = https://infoshare.stats.govt.nz/ > Population > Marriages Civil Unions and Divorces – VSM > Divorces (marriages and civil unions) (Annual-Dec)
- Additional commentary from Stats NZ that we cross-checked against = https://www.stats.govt.nz/information-releases/marriages-civil-unions-and-divorces-year-ended-december-2021/
This work is based on/includes Stats NZ’s data which are licensed by Stats NZ for reuse under the Creative Commons Attribution 4.0 International licence.
…
Did we make a mistake, or have you got smarter data? Let us know.