Key insights
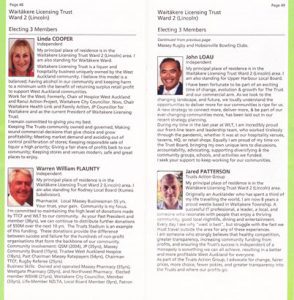
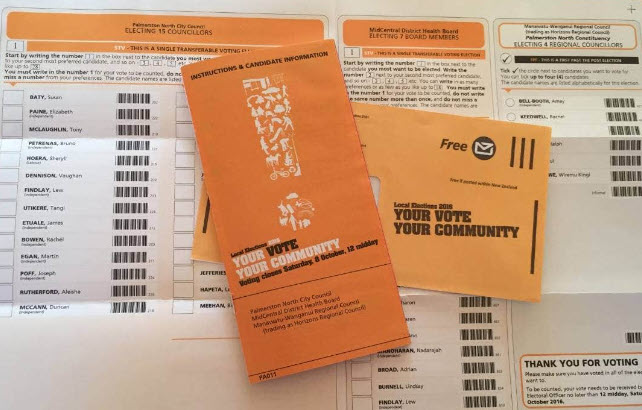
- Ballot information and voting papers are both listed alphabetically by surname.
- From our analysis, there appears to be no positional advantage or voting bias for Mayor (1st vote) or Councillors (2nd vote(s)). This is possibly because they:
- Have bigger campaign budgets.
- Have more hoardings
- Get more media coverage
- Are more likely to get high-profile endorsements
- Are more likely to carry a higher-profile themselves in the community
- Candidate lists are shorter (an average of 6.7 Councillor candidates per election for this data set vs 12.2 for Local Boards and Licensing Trusts)
- And voter decisions are more considered.
In fact, no Councillor candidate listed in the 1st or 2nd position received the most votes.
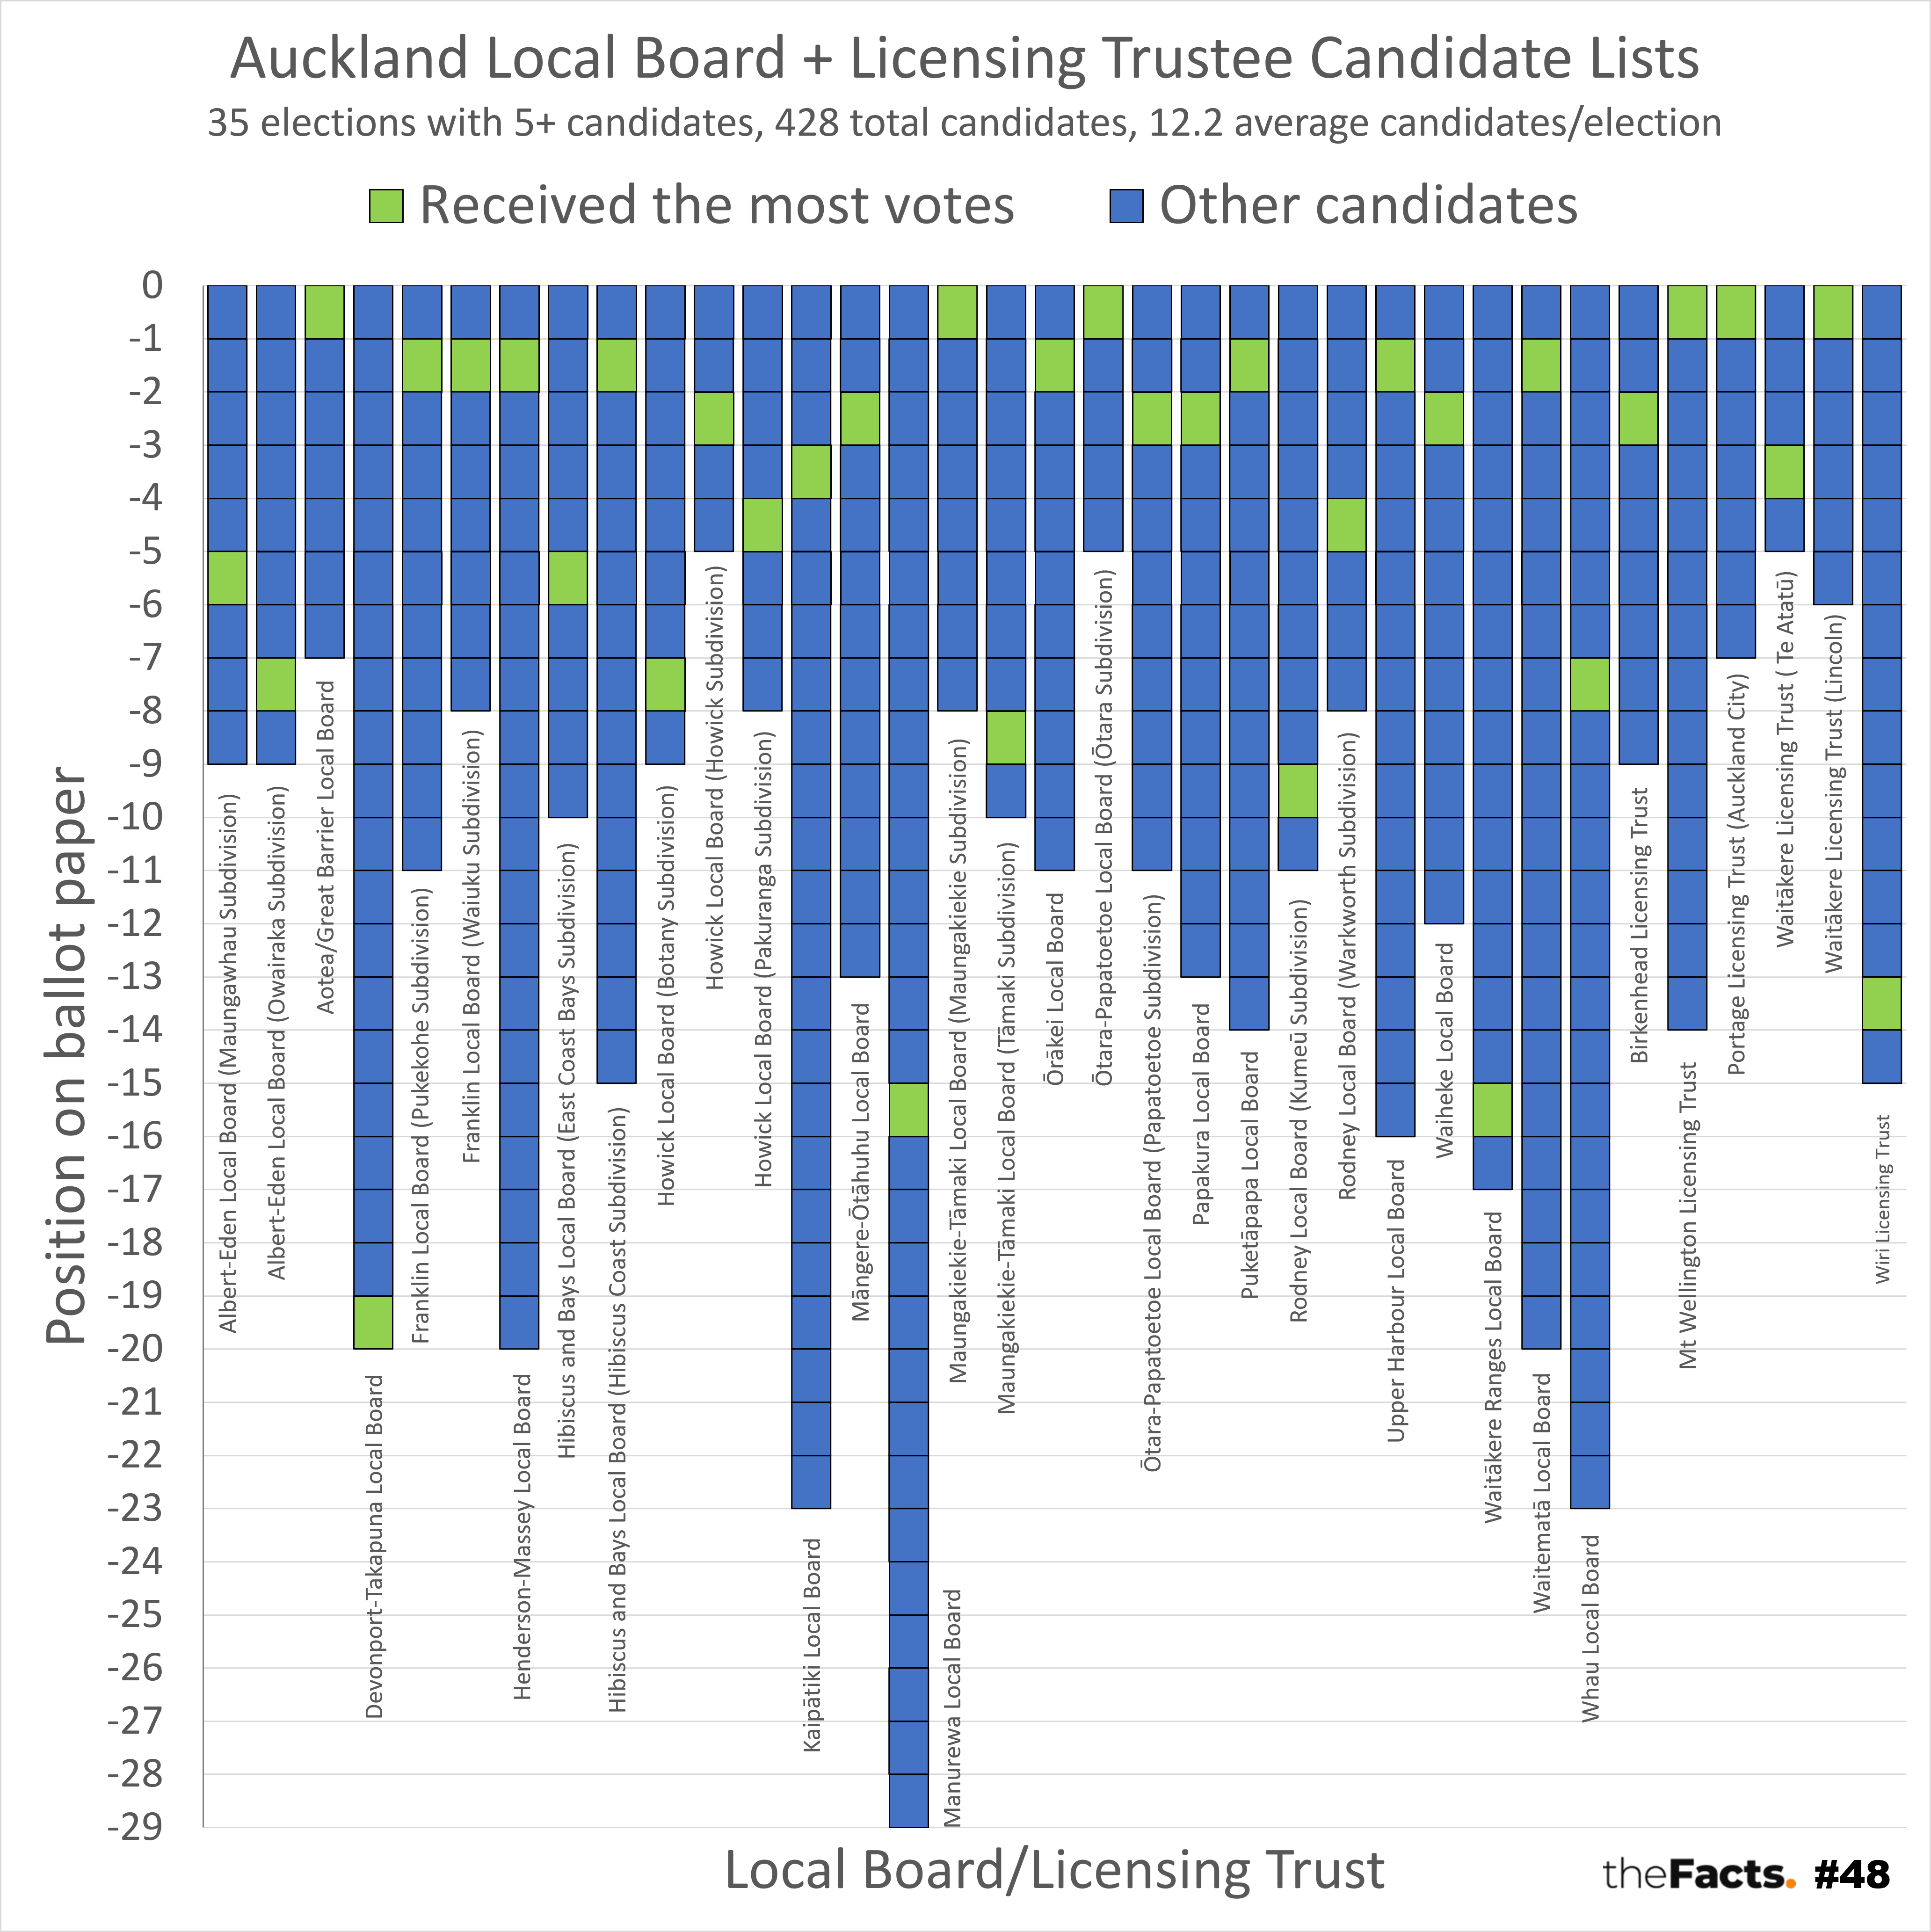
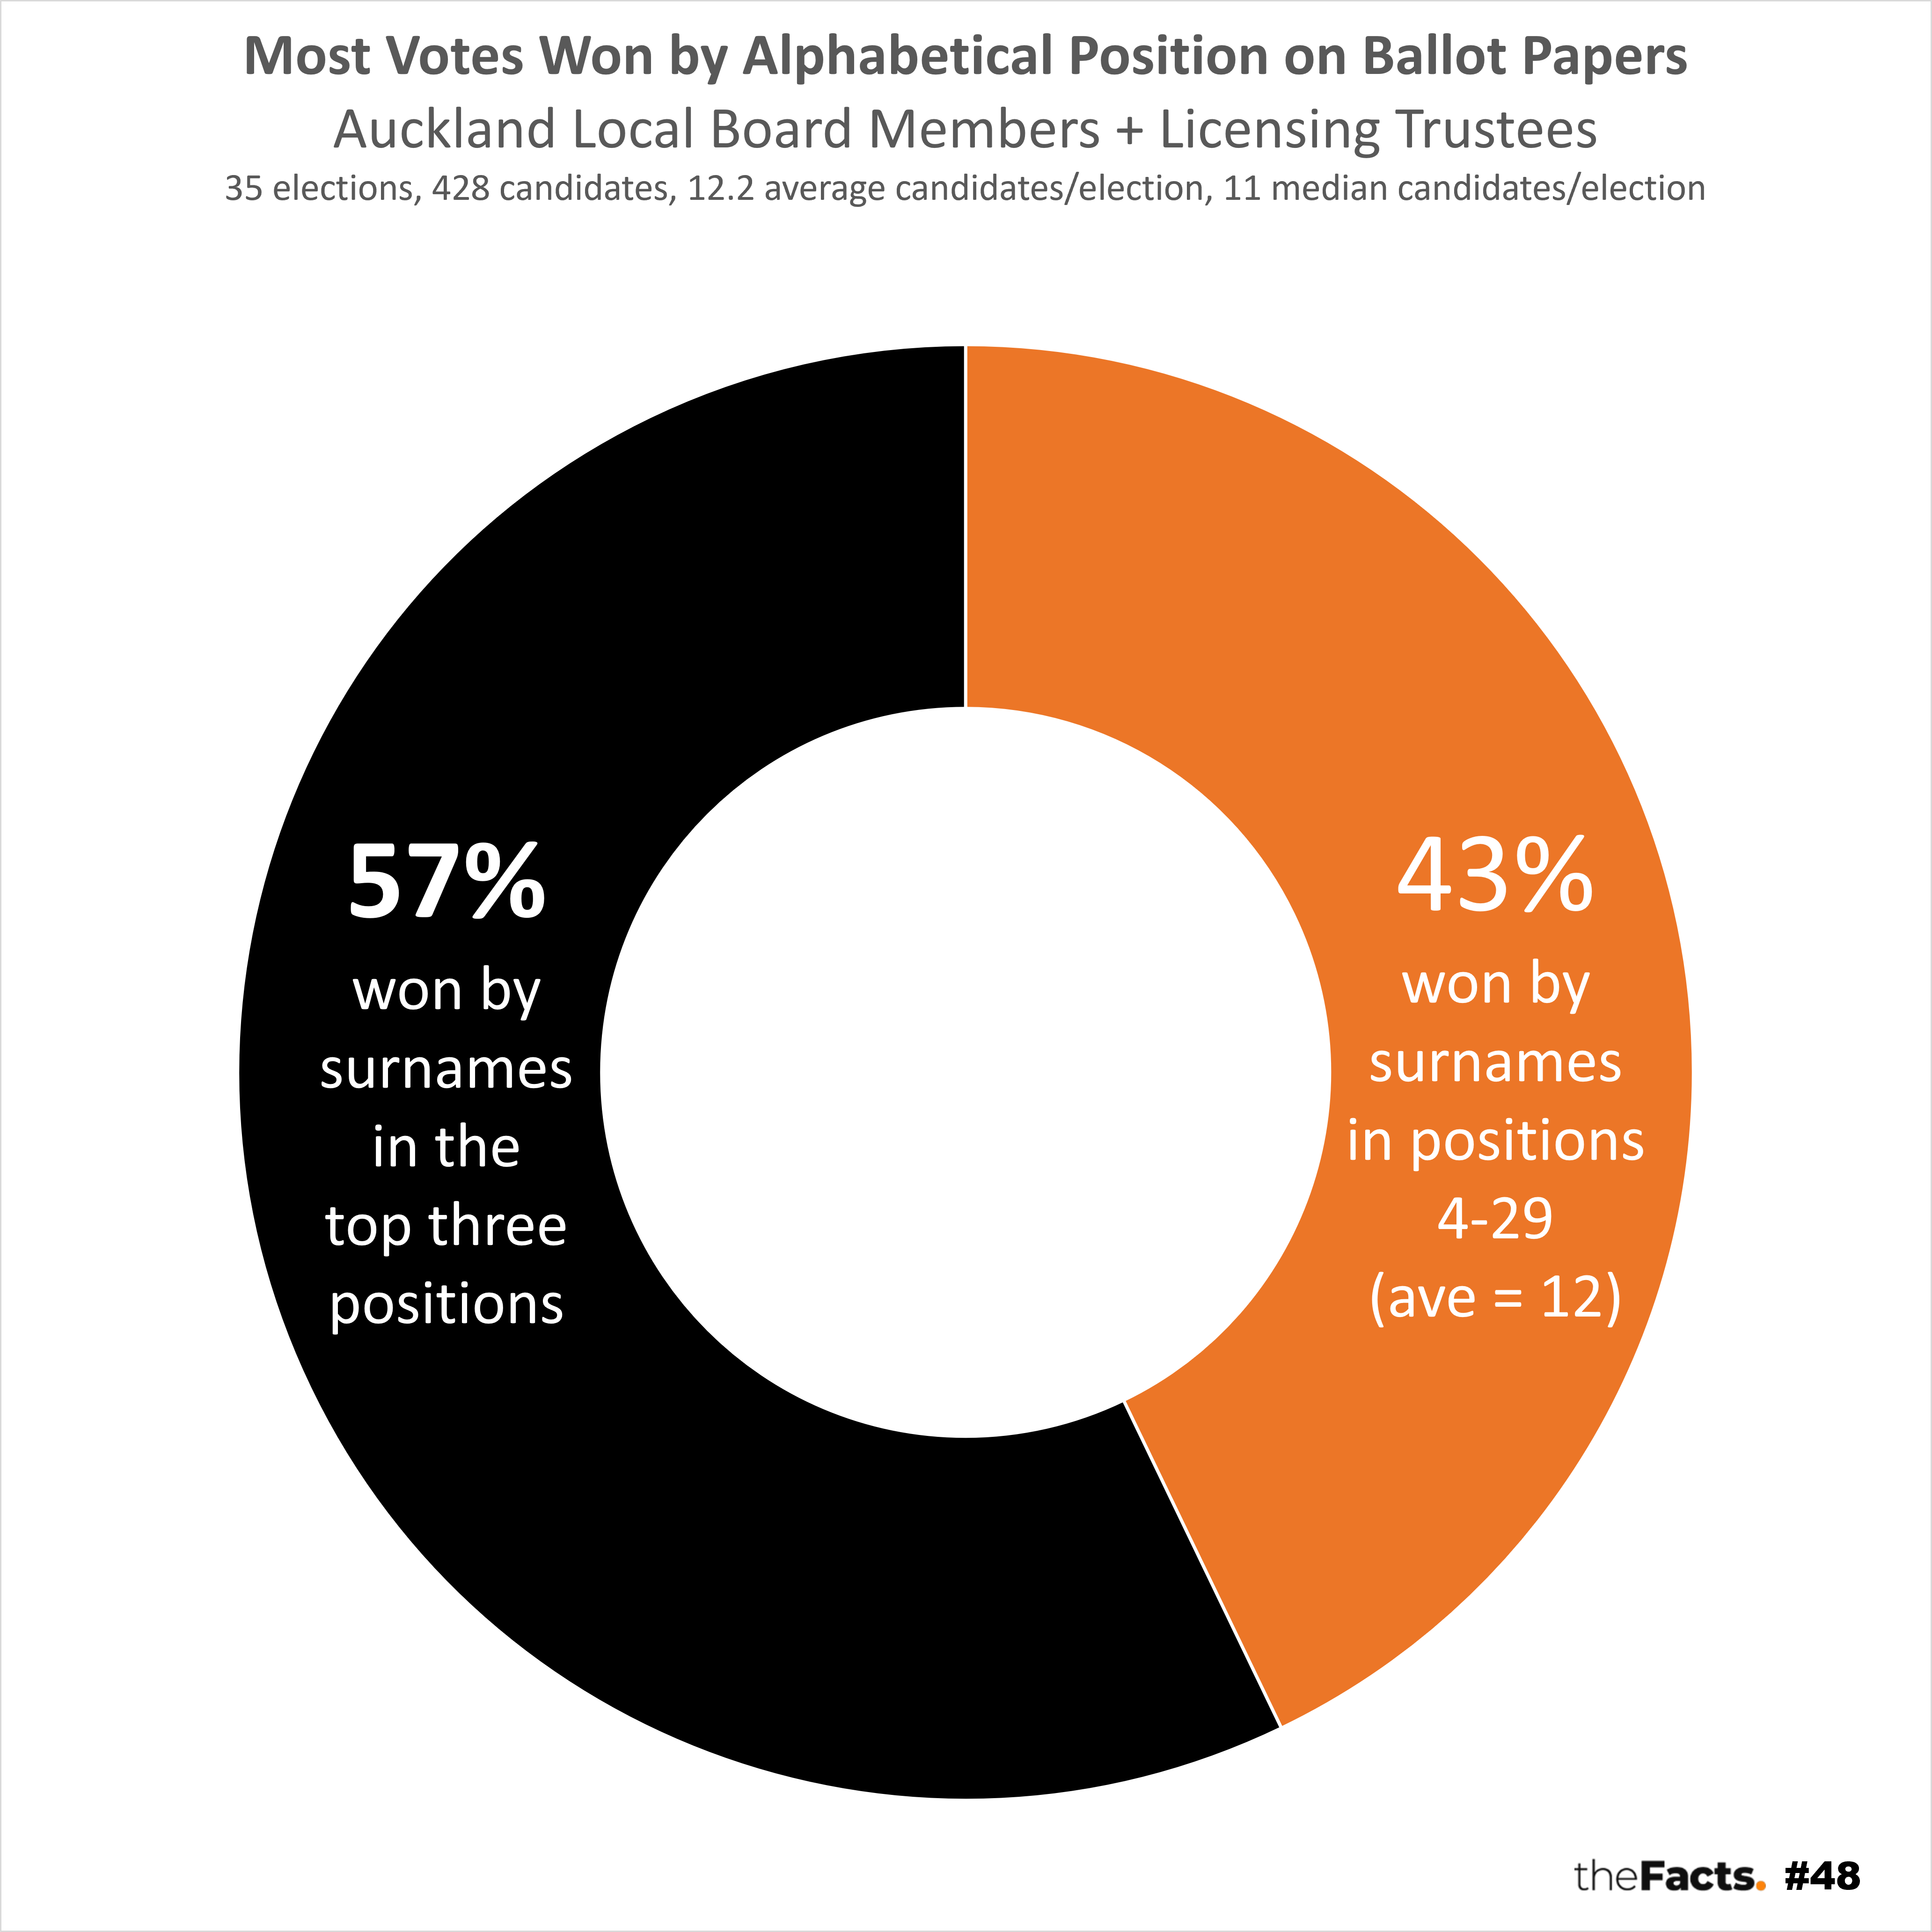
- However, for Local Board Members and Licensing Trustees:
- Based on probability, candidates in the first three positions should have won 30% of the elections.
- However, they won 57% – almost twice as many.
- In other words, those 105 candidates in the top three positions won 20 out of 35 elections (a 1 in 5 chance) vs the other 323 candidates who only won 15 of the elections (a 1 in 22 chance).
- For the 6 Licensing Trustee Elections, all of those who received the most votes were either listed in the top 3 or bottom 2.
- Candidates with surnames starting with A, B or C won over 1/3 (12/35) of those Auckland elections (Allan, Amosa, Atkinson, Autagavaia, Batucan, Bonham, Brown, Carter, Catchpole, Churton, Cole, Cooper).
- Sample:
- 35 Local Board Member and Licensing Trustee elections with 5 or more candidates (Auckland local body elections).
- 428 candidates.
- Average candidates/election = 12.2.
- Median = 11.0.
- Disclaimer – it is possible, but unlikely, that these election results are a one-off and very rare coincidence.
…
Key questions
- Why aren’t ballot information documents and ballot papers randomised in line with best-practice market research design?
- Should candidate and party lists be randomised for the 2023 general election?
…
Have your say
…
Full data
Please contact us if you would like the full analysis.
…
Notes
- All publicly available data has been included.
- We chose to use only Auckland Local Body Election data for now because:
- It represents ~1/3 of New Zealand’s population, so it’s quicker/easy to get a big sample set.
- All of the data was in one place.
- Candidate lists are often long (12.2 average candidates for Local Boards and Licencing Trustees).
- There is not yet a summary of all New Zealand local body election results in one place.
- It took 5 1/4 hours to analyse the Auckland data alone.
- However, we would love for someone to do the full analysis once all of the data is available, and will be suggesting this to Local Government New Zealand as part of their electoral review.
- We analysed elections with 5 or more candidates only because:
- When there are only 1, 2, or 3 candidates, they’re all in the top 3. We also didn’t find any significant voting differences for small lists.
- When there are only 4 candidates, 3/4 are all in the top 3. We also didn’t find any significant voting difference between lists of 4.
- We started to notice different voting patterns as candidate lists hit 5+.
- Research has consistently shown that humans struggle to deal with lists longer than 5-7 things.
- The data includes votes counted and published by the end of October 10th 2022, so could exclude some late special votes.
- There was a significant spike of wins for candidates in the second to last position on lists too (7 wins = twice as many as the probability odds). We didn’t put this in the headline as there appeared to be no advantage being listed 3rd to last or last on either side. That said, there could be a psychological advantage being listed second to last and this would be fascinating to investigate further.
- All numbers are provisional and subject to revision.
Thank you to the Factors who helped pull this together.
…
Source
- Auckland City Council https://www.aucklandcouncil.govt.nz/elections/elections-2022-results/Pages/default.aspx
Licensed for use under the creative commons attribution licence (BY) 4.0
…
Did we make a mistake, or have you got smarter data? Let us know.