INSIGHTS
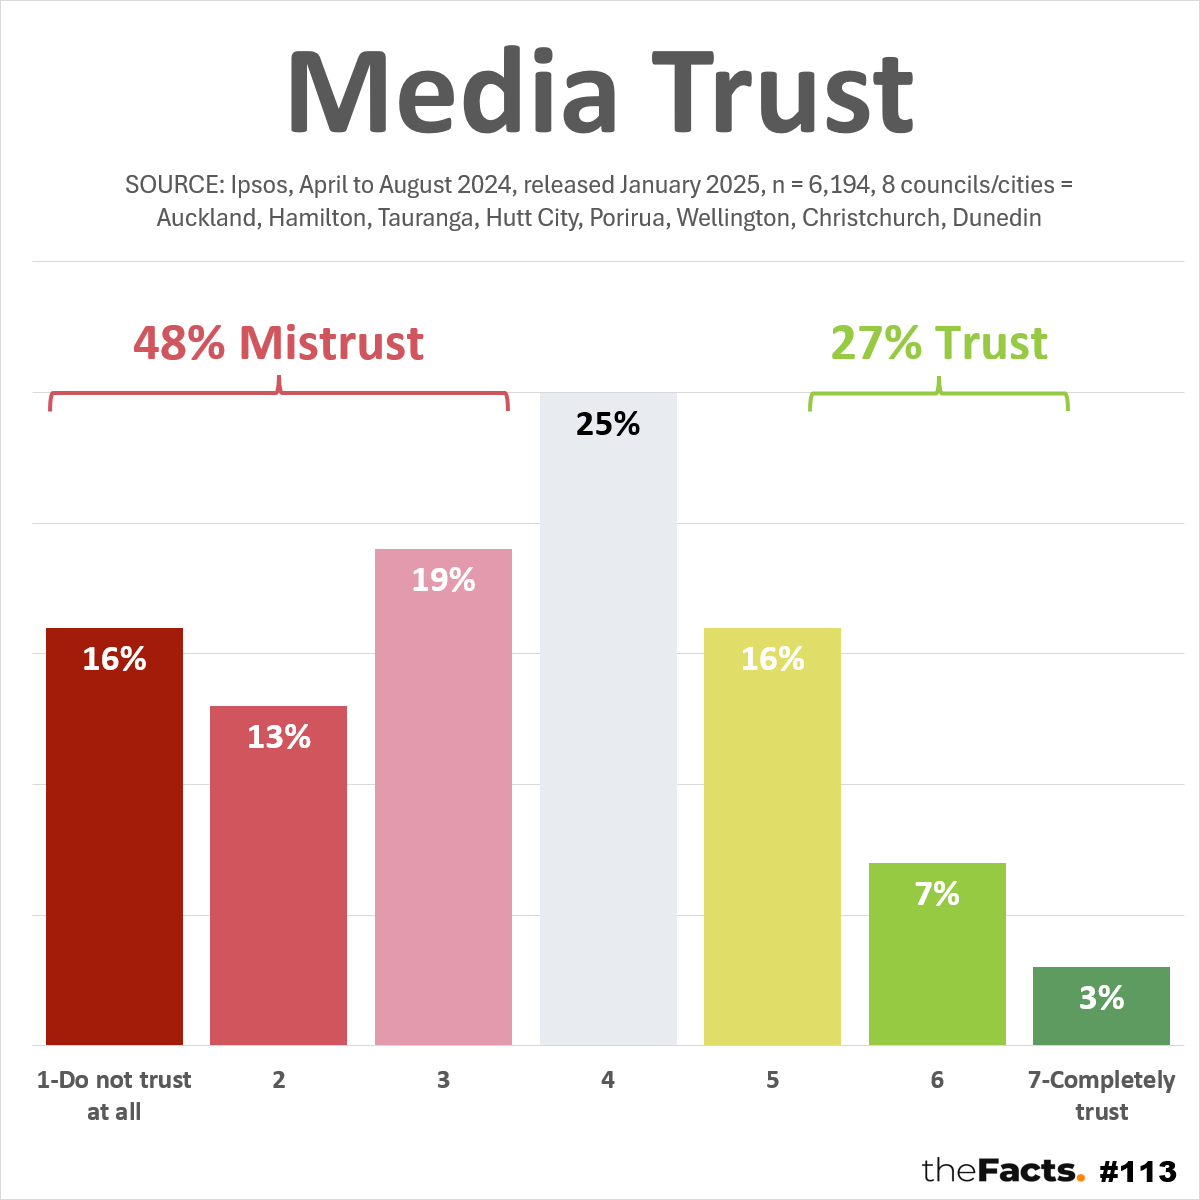
Based on the April to August 2024 research released in January 2025 by Ipsos and commissioned by 8 City Councils (Auckland, Hamilton, Tauranga, Hutt City, Porirua, Wellington, Christchurch, and Dunedin):
- 27% trust the media (~1/4)
- 25% are neutral
- 48% mistrust the media (~half)
This is lower than the 33% (1/3) media trust result from AUT’s widely publicised February 2024 research, which uses a different question-and-answer option.
It’s important to note that this Ipsos poll has a large sample of over 6,000 adult New Zealanders. The sample size increases to almost 7,000 if the Waikato Regional Council results are added to the city council results.Most polls have a sample size of 1,000.
OTHER INSIGHTS
The full trust ratings across the institutions tested were:
- The police = 68%
- Scientists = 62%
— - The public education system = 50%
- The public health system = 47%
- The justice system = 44%
— - Local government = 28%
- Central government = 28%
- The media = 27%
KEY QUESTIONS
- Is media trust continuing to decline, or is this research an anomaly?
- Given that most of the information on key voter issues comes from news media (and politicians), are you concerned by this lack of trust?
- How do we fix this media bias problem?
…
HAVE YOUR SAY
![]()
![]()
…
FULL DATA ANALYSIS
Please contact us if you would like the full data set and research.
…
ADDITIONAL NOTES:
- The fieldwork was conducted between 23 April to 1 August 2024 and released in January 2025, so there was a few months delay before it was published.
- The fieldwork dates, release data, and sample sizes are shown in the graph.
- Only voters 18+ were surveyed.
- The research question asked was:
How much do you trust the following institutions in Aotearoa New Zealand? Even if you’ve had very little or no contact with them, please base your answer on your general impression of them. (1 – Do not trust at all, 7 – Completely trust)
- We decided to show the data for the 8 city councils and omit the Waikato Regional Council (WRC) for 3 reasons:
- Only the 8-city total was given in the report. Because of rounding, adding in the WRC could introduce errors.
- We felt it best for consistency to use the city data, and not muddle it with one set of regional/rural data.
- When including the WRC data, the trust results still round to 27% (a drop from 26.9% to 26.6% using the rounded numbers available).
- Like the Ipsos report, we have considered the middle score to be neutral, anything lower to be mistrust, and anything higher to be trust. You could generate a weighted score from this data if you prefer. That would result in an even lower trust score given 16% gave a score of 1-Do not trust at all and only 3% answered 7-Completely trust. The average score was 3.4/7
- The 48% Mistrust and 27% Trust brackets are proportional in length to those who supported each option.
- We tried various visual layouts and felt ordering the graph from left to right based on rating scores with columns for the %s was the best representation.
- We used a traffic light colour scheme like that used in the report, and as we’ve used many times before where red = negative/bad and green = positive/good.
- This report also asked many other questions. See SOURCE below for the link.
- All numbers are provisional and subject to revision.
Thank you to the Factors who helped pull this together.
…
SOURCE:
Ipsos Quality of Life Survey 2024, 8-City Topline Report = https://ccc.govt.nz/assets/Documents/Culture-Community/Stats-and-facts-on-Christchurch/Quality-of-Life/Quality-of-Life-2024-8-City-Topline-report-FINAL.pdf
Data published by Auckland, Hamilton, Tauranga, Hutt City, Porirua, Wellington, Christchurch, and Dunedin City Councils, and Waikato Regional Council
(c) Crown Copyright
Licensed for use under the creative commons attribution licence (BY) 4.0
…
Did we make a mistake, or have you got smarter data? Let us know.
[/fusion_text][/fusion_builder_column][/fusion_builder_row][/fusion_builder_container]