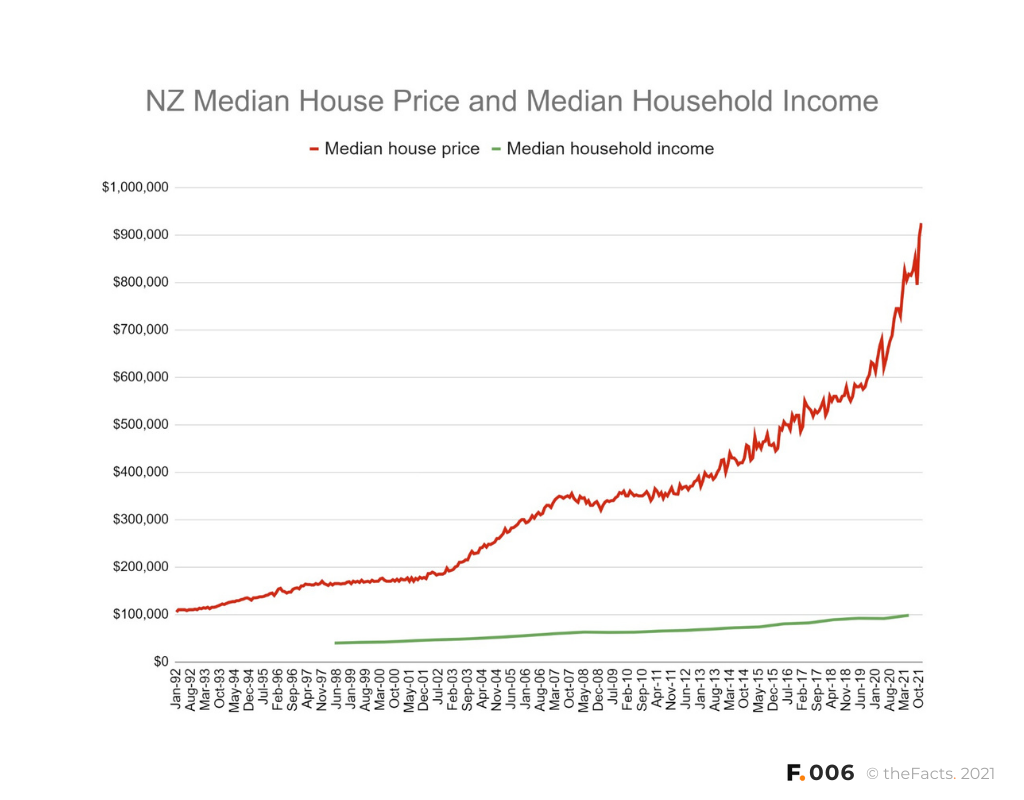
In May 1992 in New Zealand:
The median house price was $110,000
In May 1998:
The median house price was $165,000
The median household income was $39,420
= a Housing Affordability Ratio of 4.2x
In May 2021:
The median house price was $817,500
The median household income was $98,029
= a Housing Affordability Ratio of 8.3x
In November 2021:
The median house price was $925,000
We don’t know the median household income for November yet, but the Housing Affordability Ratio may have passed 9x
…
How do we solve this, New Zealand, without there being massive losers (recent buyers or first-home buyers)?
…
Have your say
…
NOTES:
- “Affordable housing” is universally recognised to mean 3x household income or less.
- REINZ median house price data:
- Available from January 1992 to November 2021.
- Past data releases, like those used above, are recalculated as new data becomes available. The data will be similar. If you want the latest recalculated data, please ask REINZ.
- If you want data before 1992, you could try local councils or Corelogic.
- Stats NZ Household Income Survey:
- Started in 1998.
- Is a sample of 15,000 households across New Zealand.
- Asks for household income as a supplement in the June quarter reports.
- If you want data before 1998, you could try the Household Economic Survey or Census data.
- All numbers are provisional and subject to revision
Thank you to the Factors who helped us pull this research together
SOURCES:
Median house prices from REINZ press releases (2017 to 2021 can be found under https://www.reinz.co.nz/press)
Median house prices crosschecked with data from https://www.interest.co.nz/charts/real-estate/median-price-reinz
Median household incomes from http://nzdotstat.stats.govt.nz/WBOS/Index.aspx?DataSetCode=TABLECODE7480
This work is based on/includes Stats NZ’s data which are licensed by Stats NZ for reuse under the Creative Commons Attribution 4.0 International licence.
–
Did we make a mistake, or have you got smarter data? Let us know.


