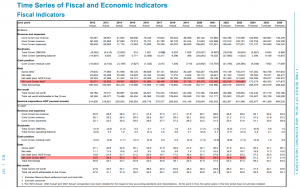
Summary table
See page 157 of Budget Economic and Fiscal Update 2022

…
Are we ok with this increase in Government debt?
…
Have your say
…
Other notes:
- The data series provided by Treasury started in the June 2012 year.
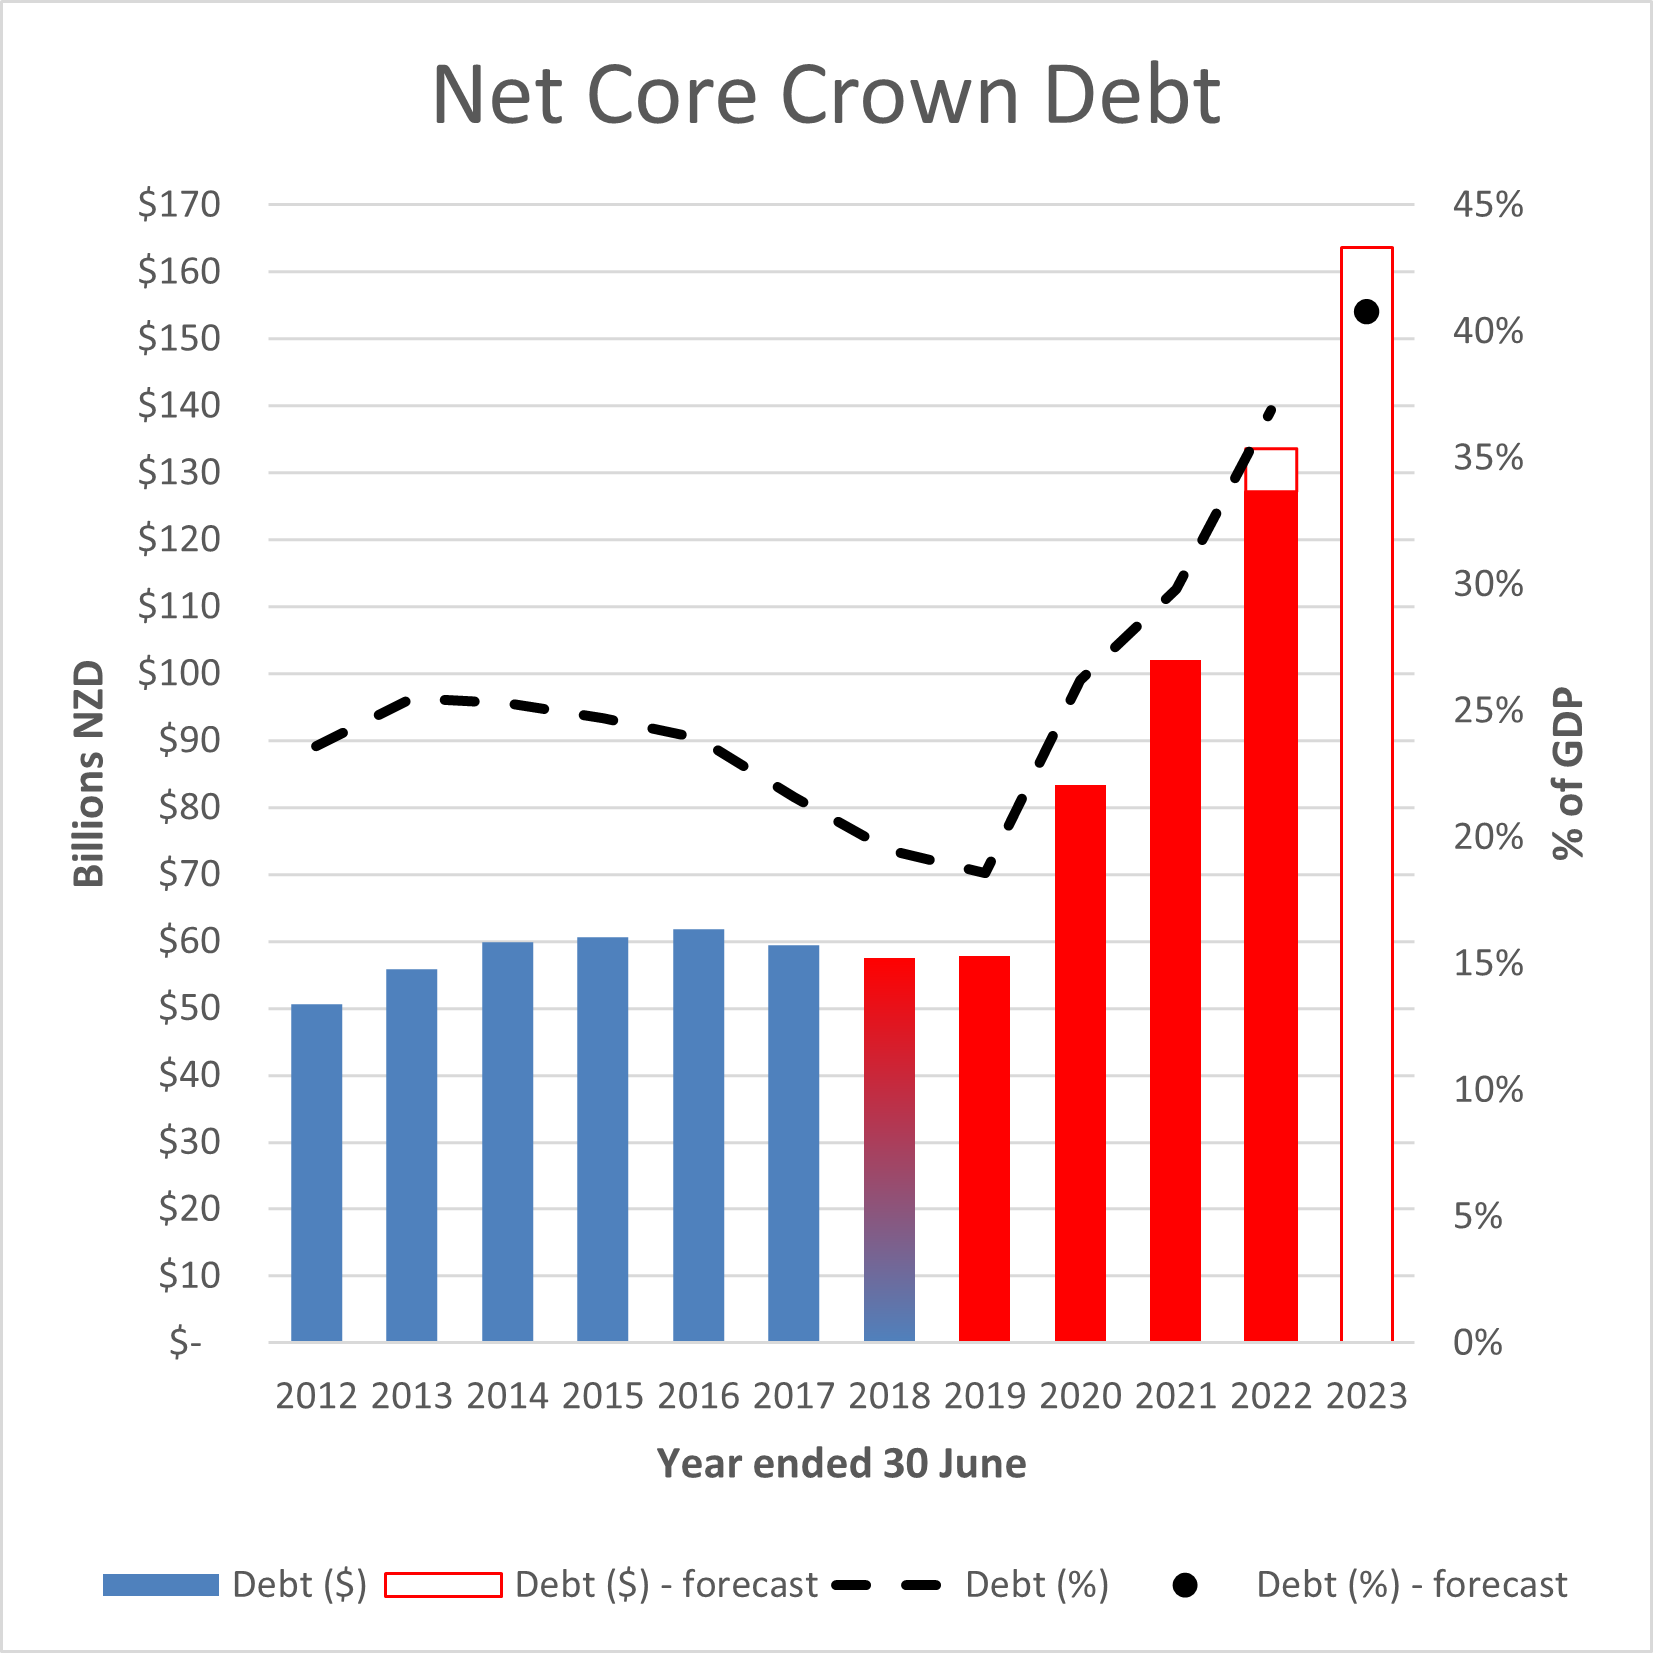
- We have used blue and red colour-coding to show which political party led the Government in each year.
- The June 2018 year shows dual colours due to the election taking place on 23rd September 2017, NZ First choosing their Government coalition partner on 19th October, and the Labour-led Government governing from 26th October.
- We only showed one forecast year on the graph (2023) due to:
- The large variance between the 2022 actuals to the 2021 budget. See last week’s fact.
- There is a general election in the 2023 year which could change Crown revenue, spending, and debt levels significantly.
- Net Core Crown Debt is the most commonly used economic indicator for Government debt.
- We chose not to use the new debt metric that includes the NZSF (New Zealand Super Fund) and other amounts, due to:
- The controversy surrounding this change.
- Data tables from 2012-2023 only being available for the previous metric.
- The 2022 figure contains actuals to March 31st and then the Treasury forecast to June 30th.
- The 2023 forecast figure assumes net debt of $164 billion and GDP of $401 billion to get the 41% of GDP figure. These are forecast figures, so could change significantly.
- We’ve shown both $ and % values to help Kiwis better understand Crown/Government debt relative to GDP.
- Additional notes from Treasury can be found in the data source pages below.
- All numbers are provisional and subject to revision.
Thank you to the Factors who helped pull this together.
…
SOURCES:
https://www.treasury.govt.nz/sites/default/files/2022-05/befu22.pdf page 157.
https://www.treasury.govt.nz/system/files/2022-05/fsgnz-9mths-mar22.xlsx (for the actual figures to the end of March 2021).
Data published by The Treasury
(c) Crown Copyright
Licensed for use under the creative commons attribution licence (BY) 4.0
…
Did we make a mistake, or have you got smarter data? Let us know.


