KEY INSIGHTS
Based on EFTS (Equivalent Full-Time Students)
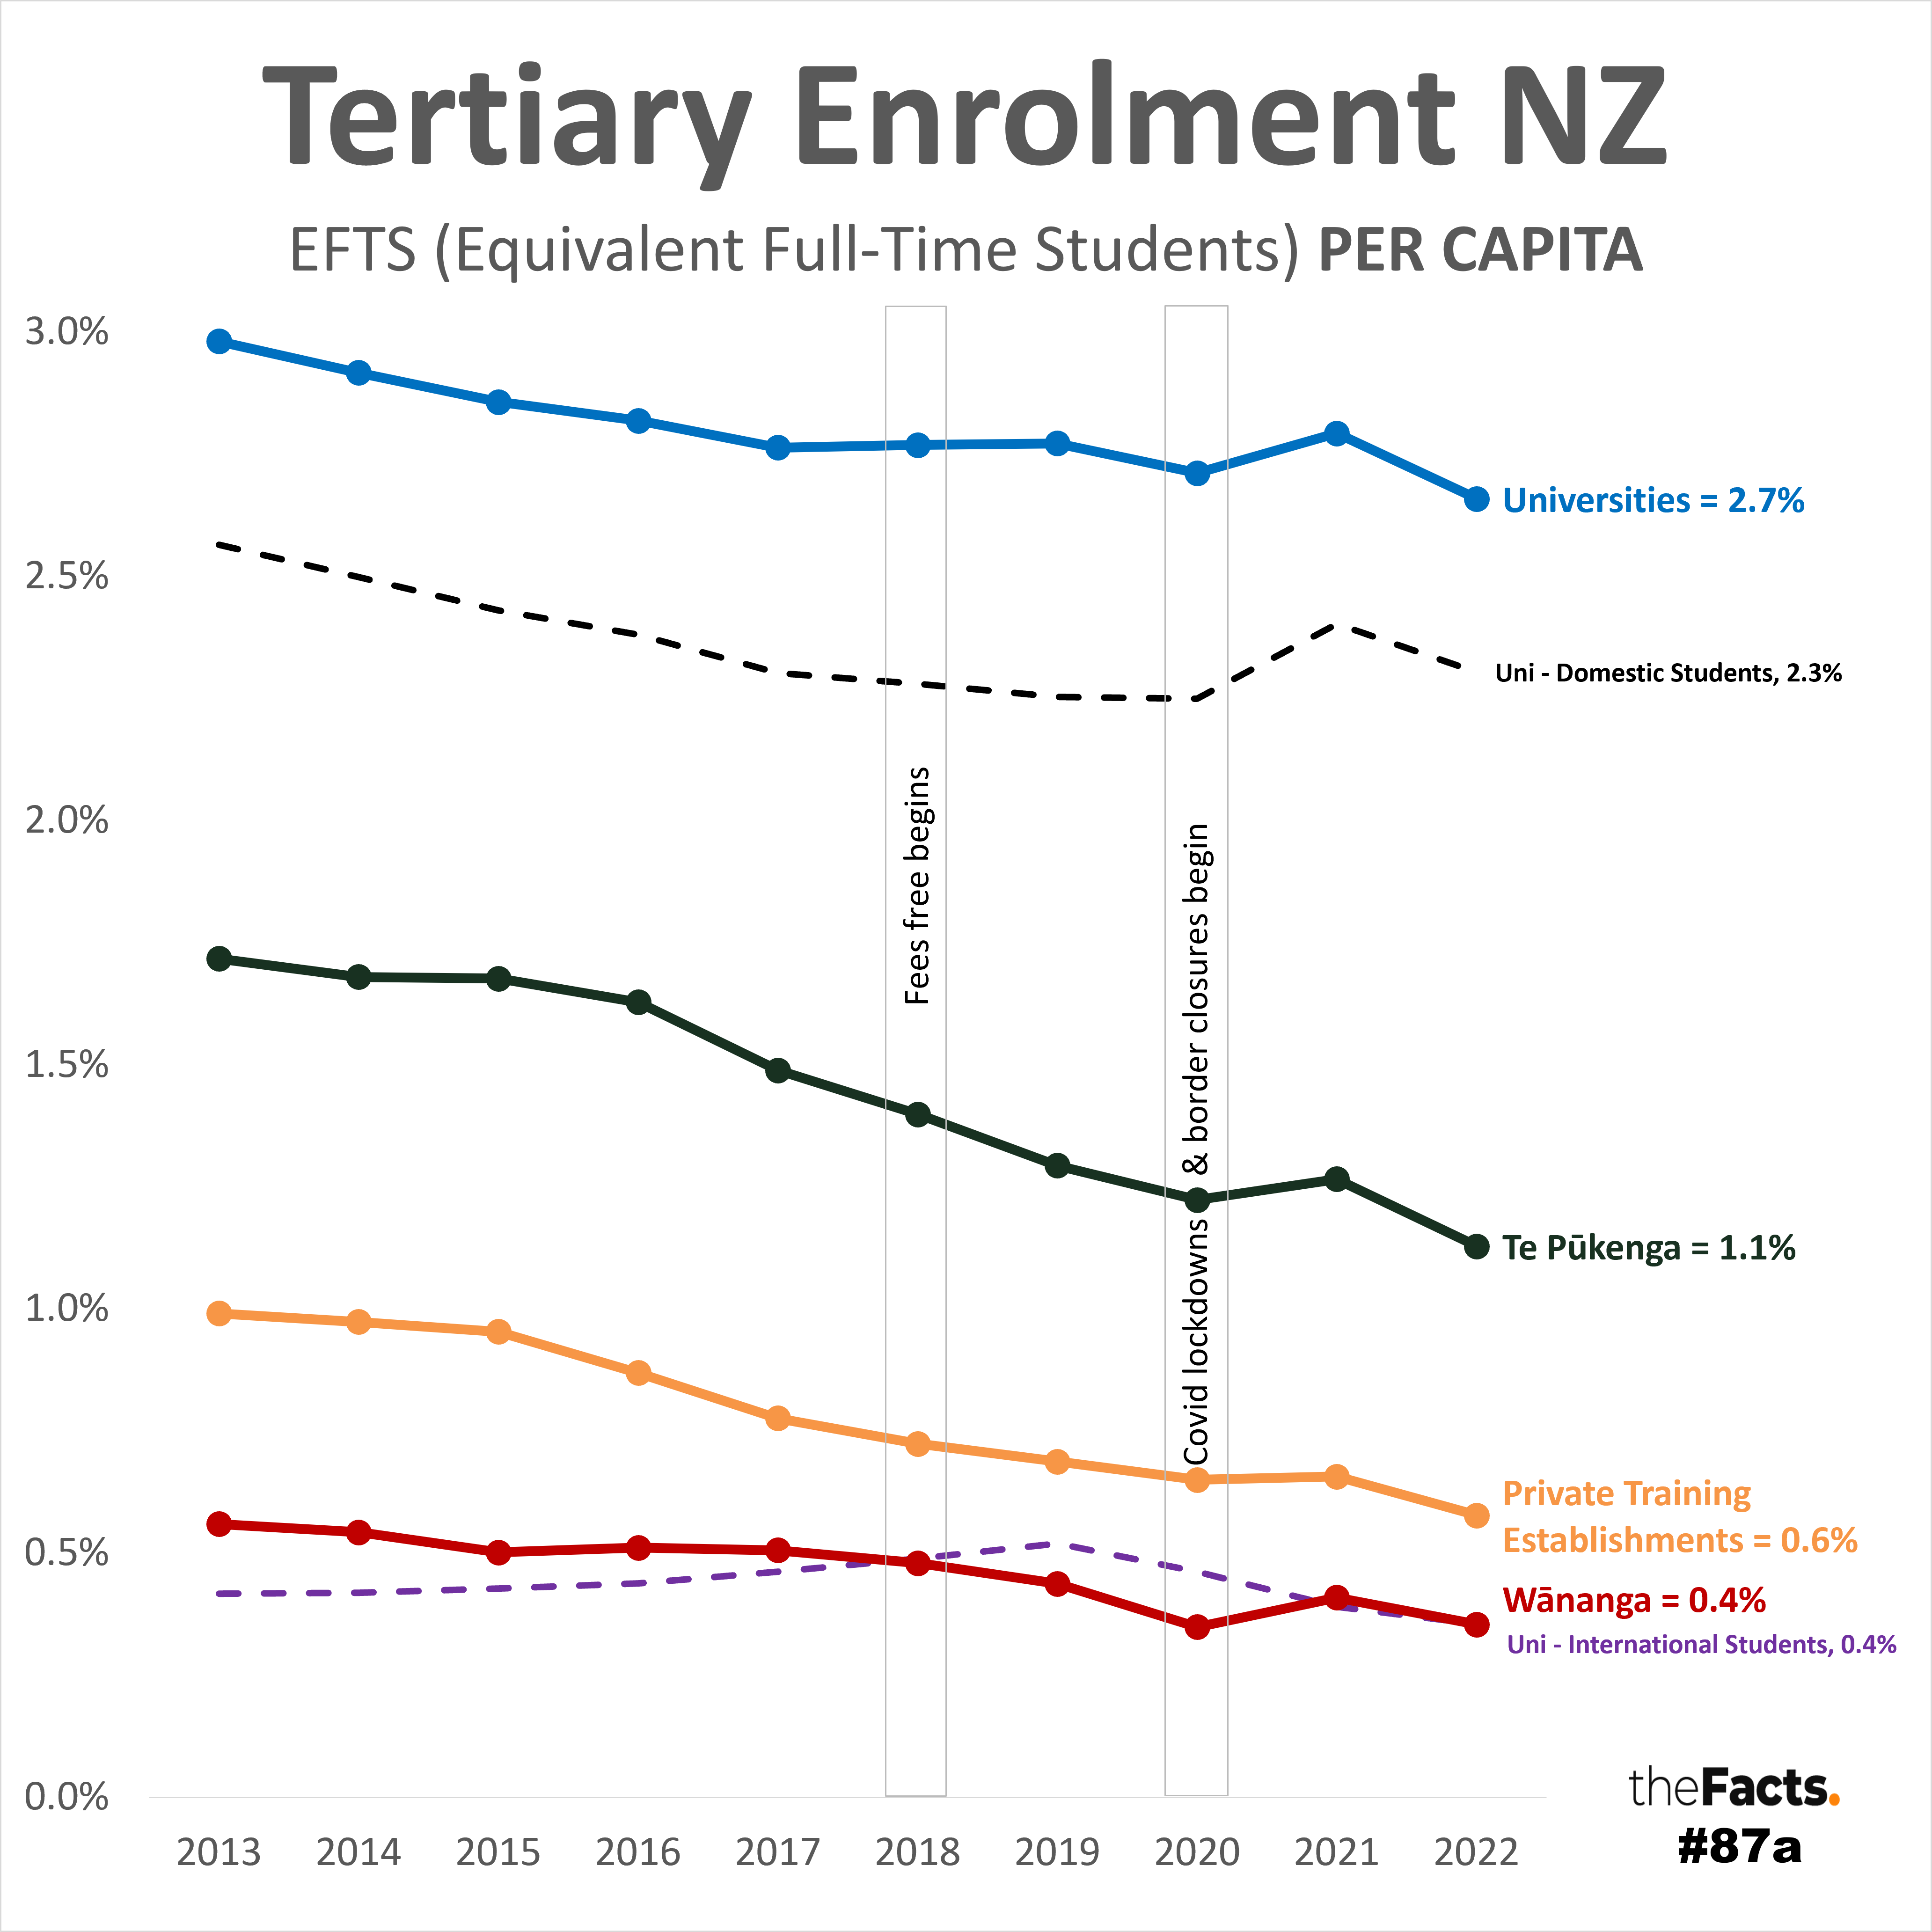
- Student enrolments PER CAPITA (AKA tertiary participation) have steadily decreased across all four tertiary education groups over the last 10 years:
- Universities (8 in NZ) decreased from 3.0% to 2.7%
- Te Pūkenga (merger of 16 Institutes of Technology and Polytechnics) decreased from 1.7% to 1.1%
- Private training establishments (various) decreased from 1.0% to 0.6%
- Wānanga (3 publicly-owned tertiary institutions that provide education in a Māori cultural context) decreased from 0.6% to 0.4%
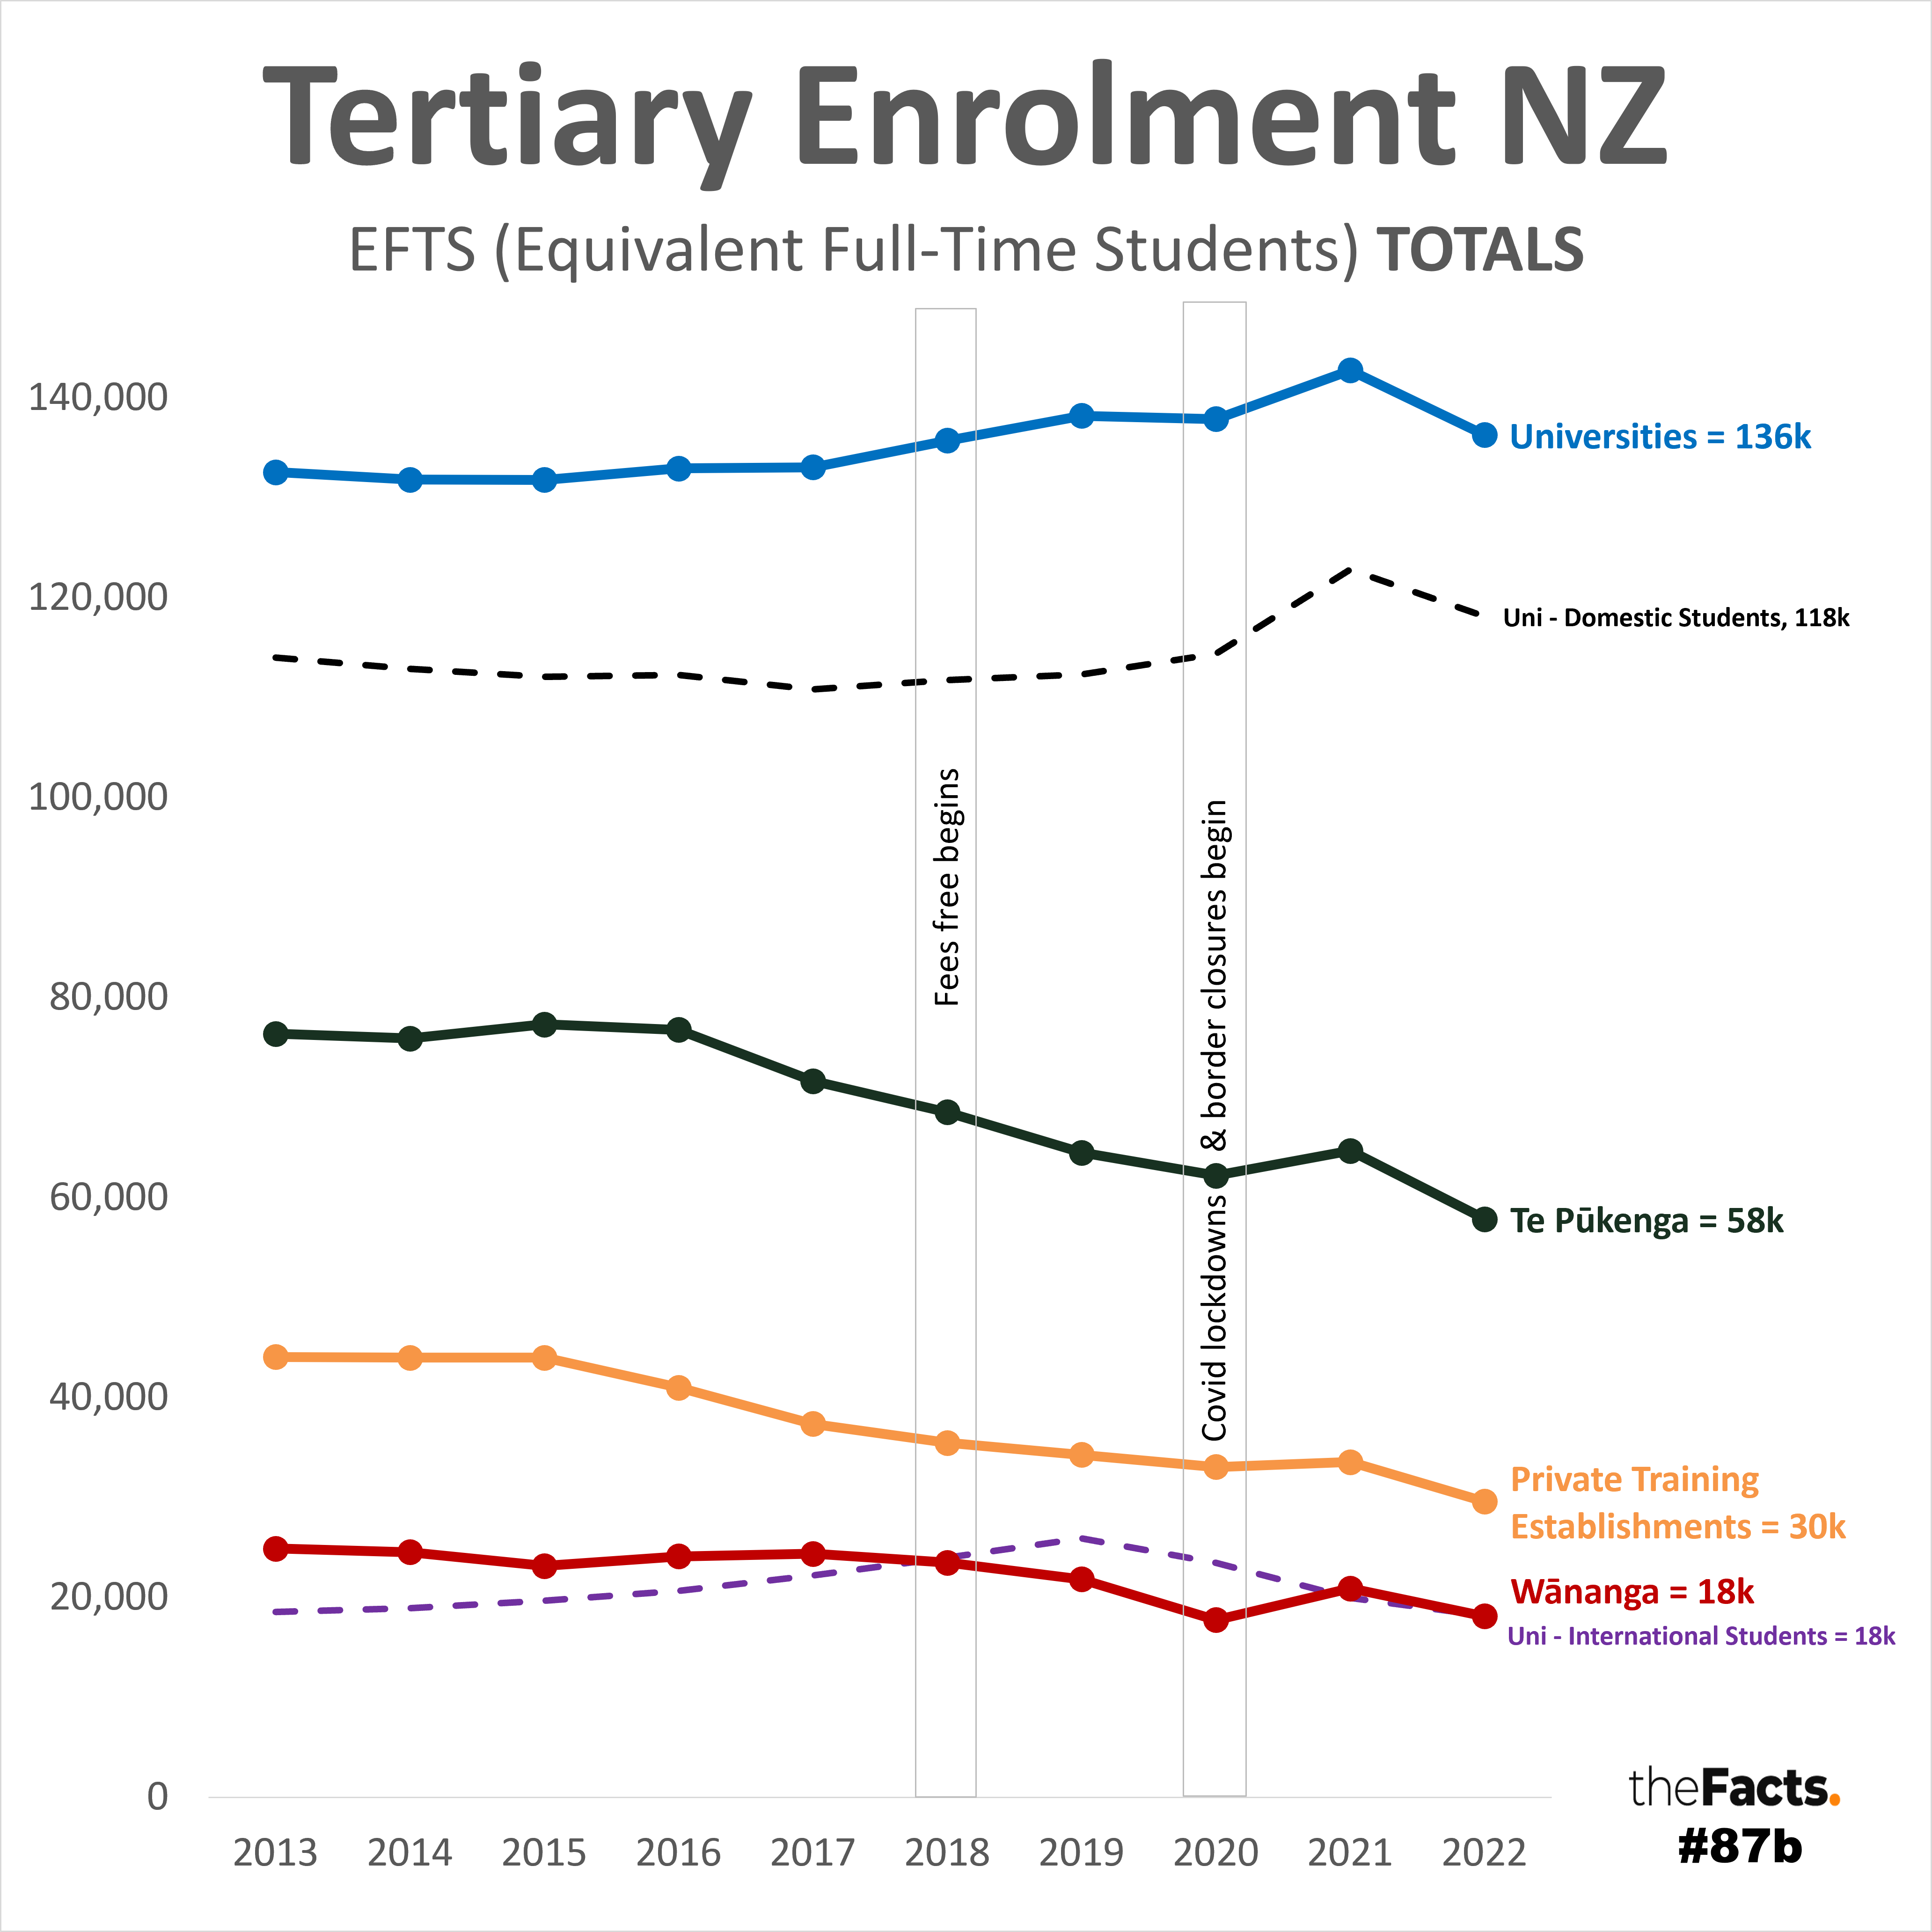
- Student enrolments in TOTAL (ignoring population growth) have also steadily decreased in all tertiary groups, except Universities. The caveat is that Universities also experienced a 6.5k decrease from 2021 to 2022 (less than Te Pūkenga’s 7k decrease that year with less than half as many students).
- The Fees Free scheme has not addressed the decline in tertiary participation. Some might argue that it slowed the decline for Universities, but 2018 and 2019’s plateauing University numbers came mostly from a) international student growth and b) Canterbury University growth. We will share a breakdown by University in the coming weeks.
- Domestic University students had a strong 8.5k uplift from 2020 to 2021, but this turned into a 4.5k decline again going into 2022.
- International University students were steadily increasing from 2013 (18.5k) to 2019 (26k), but then dropped off through Covid lockdowns and border closures, and have continued to decline every year since.
KEY QUESTIONS
- Why has tertiary participation in New Zealand dropped so steadily over the last 10 years? Is this a bad thing? If not, why not? If so, how do we fix it?
- What do we do now with the Fees Free scheme?
- Do we want to attract international students back? If so, how?
…
HAVE YOUR SAY

![]()
…
Full data analysis
Please contact us if you would like the full data set and research.
…
Notes
- We have shared all available data.
- We led with PER CAPITA measures since that is a fairer reflection of tertiary performance and participation in a growing population. However, we also included TOTALS for those who want them, and to paint a full picture.
- We also included a breakdown of University domestic and international students since the Universities make up 56% of all EFTS tertiary students in New Zealand and 78% of all international tertiary students in New Zealand.
- The Fees Free scheme was introduced by the Labour Government in 2018.
- The first Covid lockdowns and border restrictions begun in March 2020. See https://covid19.govt.nz/about-our-covid-19-response/history-of-the-covid-19-alert-system/ for a full breakdown.
- We used NZ population estimates for December months.
- How we chose today’s colours:
- Universities = blue since 3 of the larger universities are from areas with a blue regional colour – Auckland, Auckland, Otago.
- Domestic University students = black, New Zealand’s national colour.
- International University students = purple to stand out from other colours.
- Te Pūkenga = the dark green from their website
- Private training establishments = orange to stand out from other colours.
- Wānanga = dark red which features prominently in 2 of the Wānanga websites, and is a colour commonly used in Māori culture
- Universities = blue since 3 of the larger universities are from areas with a blue regional colour – Auckland, Auckland, Otago.
- All numbers are provisional and subject to revision.
Thank you to the Factors who helped pull this together.
…
SOURCES:
- Tertiary numbers = https://www.educationcounts.govt.nz/statistics/tertiary-participation#:~:text=Total%20participation,in%202022%20than%20in%202021. > Provider-based equivalent full-time students > EFT.9
Data published by The Ministry of Education
(c) Crown Copyright
Licensed for use under the creative commons attribution licence (BY) 4.0
- NZ population = https://infoshare.stats.govt.nz/ > Population > Population Estimates – DPE > Estimated Resident Population by Age and Sex (1991+) (Annual-Dec).
This work is based on/includes Stats NZ’s data which are licensed by Stats NZ for reuse under the Creative Commons Attribution 4.0 International licence.
…
Did we make a mistake, or have you got smarter data? Let us know.