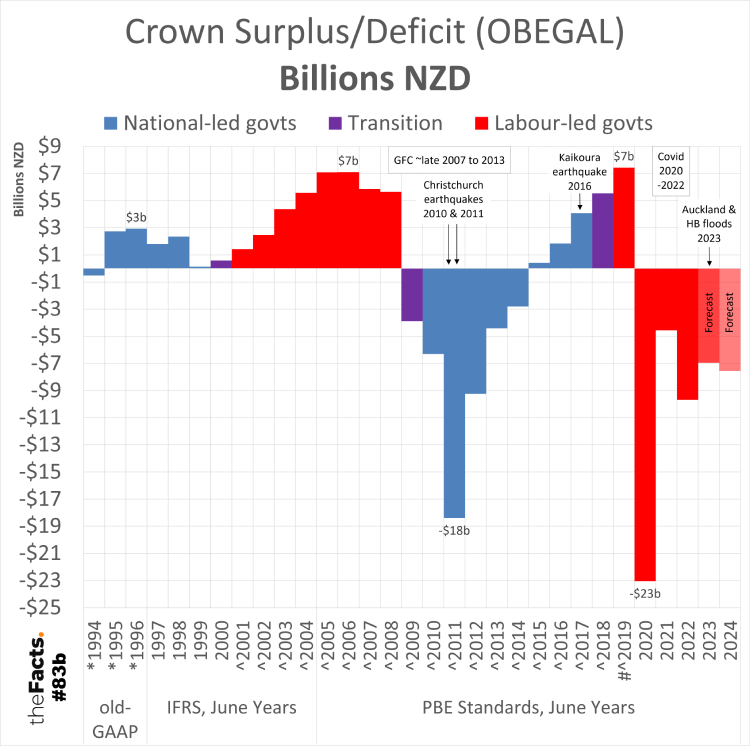
KEY NOTES
- OBEGAL stands for operating balance before gains and losses. It is the difference between Total Crown (Government) revenue and expenses and is the number we hear mentioned in political and media reports about whether there is a surplus or deficit for that financial year.
- We have added annotations for events that had a major impact on Government spending in those years. If you believe some key events since 1994 have been omitted, or there’s a better way to present this, please let us know.
- Since the 2023 June Financial Year is almost complete, the 2023 Forecast figure is based mostly on actual data. We have left it labeled as “Forecast” rather than breaking out the actual vs forecast numbers, and shown it in an almost-red shade.
- We have chosen to show out to the 2024 Forecast figures for two reasons:
- Previous forecasts have proven to be inaccurate.
- There is a general election on October 14 which could change Crown revenue, spending, surplus/deficit, and debt levels significantly.
- % of GDP is generally considered the better way to measure Government revenue, spending, and surplus/deficit as it accounts for inflation, population, and economy changes.
KEY INSIGHTS
- Aside from 1994 and 2009, the Jim Bolger/Jenny Shipley National-led Governments, and the Helen Clark Labour-led Governments delivered surpluses.
- New Zealand Government’s have delivered 10 deficits in the last 15 years. The GFC, earthquakes, Covid and floods have obviously had a significant impact on these numbers.
- Deficits are also forecast for 2024 and 2025 (not shown). A surplus is forecast for 2026 and 2027.
KEY QUESTIONS
Q1. Were we happy with the spending and return to surplus speed by the John Key/Bill English National-led Governments through the GFC and earthquakes?
Q2. Are we happy with the spending and forecast return to surplus by 2026 by the Jacinda Ardern/Chris Hipkins Labour-led Governments through Covid and floods?
…
Have your say
![]()
![]()
…
Full data analysis
Please contact us if you would like the complete data set and research.
…
Other notes:
- We have led with the % of GDP graph since % of GDP is generally considered the better way to measure Government tax revenue, spending, and surplus/deficit as it accounts for inflation, population, and economy changes.
- We’ve shown both % and $ values in dual graphs to help New Zealanders better understand Crown/Government revenue, spending, and surplus/deficit relative to GDP. Combining these into one graph, as we have done in the past, hindered comprehension for some audiences, so we felt it was best to split them apart.
- Actual data from before 1994 was not included in this data set. We have asked Treasury if there is a way to compare OBEGAL from 1994 onwards with previous measures.
- Footnote indicators:
- *GAAP data for Total Crown Operating Balance, core Crown tax Revenue and core Crown Revenue for these years has not been backdated on IFRS basis.
- ^ Total Crown revenue has been restated to exclude Income Related Rent Subsidy between government reporting entities.
- # 2019 results have been restated in the adoption of new PBE standards. Further information can be found in note 28 of the 2019/20 financial statements of government.
- The $ figures put 1994-1996 under the “old-GAAP” framework, but the % figures have put this under “IFRS”. We have asked Treasury why.
- Since the 2023 June Financial Year is almost complete, the 2023 Forecast figures are based mostly on actual data. We have left it labeled as “Forecast” rather than breaking out the actual vs forecast numbers, and shown it in an almost-red 25% transparency shade. The 2024 Forecast is shown in a 50% red shade.
- We’ve shown data labels for the peaks and troughs for each Government to help comprehension. The graph became too cluttered when data labels were added for all years.
- For the colours used in the graph:
- We chose red for Labour-led Governments to reflect the party’s primary brand colour.
- We chose blue for National-led Governments to reflect the party’s primary brand colour.
- We chose purple for years where there was a transition between National and Labour-led Governments. During these years, the incoming Government inherits roughly half a year of July-June financial performance from the previous Government:
- The 1999 general election was held on 27 November 1999
- The 2008 general election was held on 8 November 2008
- The 2017 general election was held on 23 September 2017
- We will ask Treasury if there is a way to split the financial performance of Governments during transitions into 6-monthly, quarterly, or monthly figures.
- Other key event dates:
- The start and end dates of the GFC for New Zealand can be debated. We have chosen late 2007 to 2013. This is supported by this Government publication.
- The two major Christchurch earthquakes happened on the 4th September 2010 and 22nd February 2011.
- The Kaikoura earthquake happened on the 14th November 2016.
- For Covid, New Zealand’s international borders closed on the 19th March 2020, the first Level 3 lockdown begun on the 23rd March 2020, the final 107-day Auckland lockdown ended on the 2nd December 2021, and Covid support payments/packages were provided through the early months of 2022.
- The major Auckland floods happened on the 27th January 2023.
- Cyclone Gabrielle hit the Hawke’s Bay on the 13th and 14th of February 2023.
- Additional notes from Treasury can be found in the data source pages below.
- All numbers are provisional and subject to revision.
Thank you to the Factors who helped pull this together.
…
SOURCES:
- 1994-2022 = https://www.treasury.govt.nz/publications/information-release/data-fiscal-time-series-historical-fiscal-indicators
- 2013-2027 = https://www.treasury.govt.nz/publications/efu/budget-economic-and-fiscal-update-2023 and then Budget Economic and Fiscal Update 2023 – Charts and Data and then go to right to the second to last worksheet called “Time Series Fiscal”
Data published by The Treasury
(c) Crown Copyright
Licensed for use under the creative commons attribution licence (BY) 4.0
…
Did we make a mistake, or have you got smarter data? Let us know.