KEY INSIGHTS
Of all New Zealand’s inflation in the March 2023 quarter:
- 78% was caused by non-tradable (primarily domestic) inflation
- 22% was caused by tradable (primarily international) inflation
Update for the June 2023 quarter:
- 70% was caused by non-tradable (primarily domestic) inflation
- 30% was caused by tradable (primarily international) inflation
KEY QUESTION
Why are we being misled about the impact of offshore events on our inflation levels?
…
HAVE YOUR SAY

![]()
…
WORKINGS TABLES
| Dec-22 index | Mar-23 index | % increase | Weighting | Weighted % increase | Adjusted to 100% | |
|---|---|---|---|---|---|---|
| Tradables | 1163 | 1171 | 0.69% | 41.12% | 0.28% | 22.03% |
| Non-tradables | 1235 | 1256 | 1.70% | 58.88% | 1.00% | 77.97% |
| TOTAL | 1203 | 1218 | 1.25% | 100% | 1.28% | 100% |
| Mar-23 index | Jun-23 index | % increase | Weighting | Weighted % increase | Adjusted to 100% | |
|---|---|---|---|---|---|---|
| Tradables | 1171 | 1180 | 0.77% | 41.12% | 0.32% | 29.64% |
| Non-tradables | 1256 | 1272 | 1.27% | 58.88% | 0.75% | 70.36% |
| TOTAL | 1218 | 1231 | 1.07% | 100% | 1.07% | 100% |
…
Full data analysis
Please contact us if you would like the full data set and research.
…
Notes
- We have shared all publicly available data.
- To achieve this contribution figure, you need to adjust the tradable and non-tradable indexes by their weighting contributions toward the total CPI figure.
- We have had several conversations with Stats NZ who have confirmed that our method, calculations, and headline statement are correct.
- Stats NZ gives the index numbers in whole rounded numbers to 4 digits, with no decimal places. Stats NZ said they do not and can not publish the decimal place index numbers. Their additional comments:
- “Unfortunately we don’t publish rounded index numbers, we do however have the percent change to 3 decimal places on table 7.01 (quarterly) and 7.02 (annual) on these tables https://www.stats.govt.nz/assets/Uploads/Consumers-price-index/Consumers-price-index-March-2023-quarter/Download-data/consumers-price-index-march-2023-quarter.xlsx, and these are considered more accurate as it is the sum of all the percentage points contributions from lower level groups/subgroups, these can often be slightly different to the headline figure due to rounding.”
- This figure for quarterly CPI is 1.292 in March 2023 quarter which would match very closely with your first calculation when using 1.297.”
[Since this is a total figure, and not split out by tradables and non-tradables, we could not use it, however, it is good to crosscheck this total with our work to know that our calculations without the decimal placed index numbers are very close.] - “The 1.2% increase is the official inflation rate for the March 2023 quarter. It’s impossible to calculate any aggregation of the CPI contribution perfectly, either by summing each group or summing tradables and non-tradables. By design, no official measure of inflation is calculated using unrounded index numbers which means that these discrepancies will always exist.”
- “We publish to the same level of detail that is international best practice. Publishing or supplying figures with decimal places implies a level of precision that does not exist. This is the same as other releases only publishing to the nearest million dollars.”
- “Table 7 is an analytical series that uses an unrounded index number. This table does not represent the official inflation rate and can only ever be used to help explain the movements in the official figures. This table uses unrounded index numbers because not doing so increases the likelihood of the contributions showing a reverse movement when an index is near a rounding boundary.”
- “The most accurate that you could get it is applying the weighted change for tradables to non-tradables to the official inflation measure. It’s not exact, and the weights actually update every quarter through a process known as price-updating (which we can provide more information on if you’d find it helpful), but doing anything else will result in incorrect figures and will be misleading.”
- In terms of tradable vs non-tradable and international vs domestic definitions and language, Stats NZ have said:
- “Yes, saying ~78% of inflation caused by non-tradables is correct. Many media outlets describe non-tradable inflation as domestic inflation and it’s generally fine though not necessarily the most precise description.”
- “The distinction between tradables and non-tradables is that tradables are either imported OR have competition from imported products. Tradables vs non-tradables isn’t quite international vs domestic inflation. There can be domestic influences on the tradables and international influences on non-tradables which is why non-tradable inflation could be described more precisely as being “primarily domestic”.”
- “We use the following wording when we refer to non-tradables: Non-tradeable inflation measures final goods and services that do not face foreign competition and is an indicator of domestic demand and supply conditions. However, the inputs of these goods and services can be influenced by foreign competition.”
- “We published an analytical piece back in 2004 before we introduced the tradables and non-tradables series which you can access from the Stats NZ Store House.”
- “Some news media tend to just call it [non-tradables] domestic inflation which is ok. Specifying that it’s primarily domestic does make it more precise.”
- The CPI does not include housing inflation or mortgage interest inflation. The HLPI discounts the value of houses so is not a true measure of housing price or mortgage inflation either. More on this in coming weeks and months as we research it deeper.
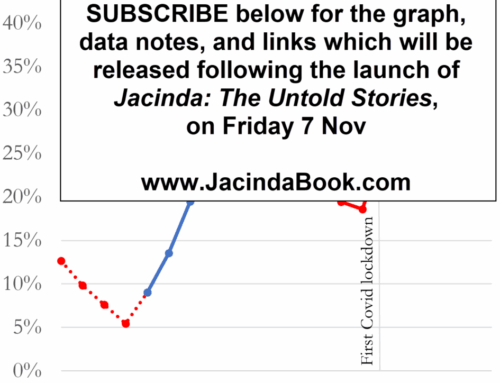
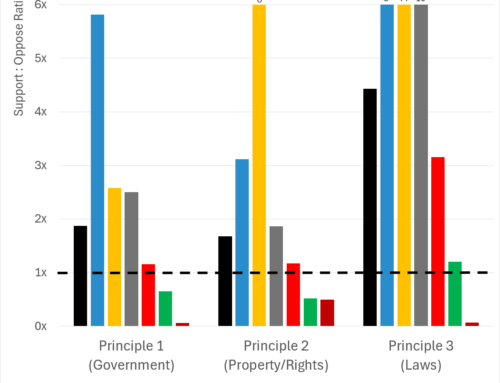
- The graph colours today were the default out of Excel.
- All numbers are provisional and subject to revision.
Thank you to the Factors who helped pull this together.
…
SOURCES:
- CPI index numbers (March) = https://www.stats.govt.nz/information-releases/consumers-price-index-march-2023-quarter/ > Consumers price index: March 2023 quarter > Table 1
- CPI index numbers (June) = https://www.stats.govt.nz/information-releases/consumers-price-index-june-2023-quarter/ > Consumers price index: June2023 quarter > Table 1
- CPI tradeable and non-tradeable weightings = https://www.stats.govt.nz/methods/price-index-methods-updates-for-the-september-2022-quarter > Consumers price index reweight 2022 > Table 6
This work is based on/includes Stats NZ’s data which are licensed by Stats NZ for reuse under the Creative Commons Attribution 4.0 International licence.
…
Did we make a mistake, or have you got smarter data? Let us know.