KEY NOTES
- From https://www.treasury.govt.nz/sites/default/files/2018-02/fiscalind-fsg.pdf:
- “The largest part of the total Crown is core Crown, which comprises ministers, departments, offices of Parliament, the New Zealand Superannuation (NZS) Fund and the Reserve Bank of New Zealand. The core Crown is a useful unit of analysis for considering fiscal management because spending approved by Parliament via appropriation acts is administered by departments – over which Ministers tend to exercise most direction.”
- “Crown entities perform a range of functions, including service delivery, regulatory oversight, and funds administration. They are named in the Crown Entities Act 2004 and operate with varying levels of independence from ministerial direction, usually being accountable to boards appointed by Ministers.”
- “SOEs were established under the State-Owned Enterprises Act 1986 with the objective of operating as profit-oriented businesses. Boards of directors are appointed by shareholding ministers to be responsible for running each company, with government’s role being that of owner.
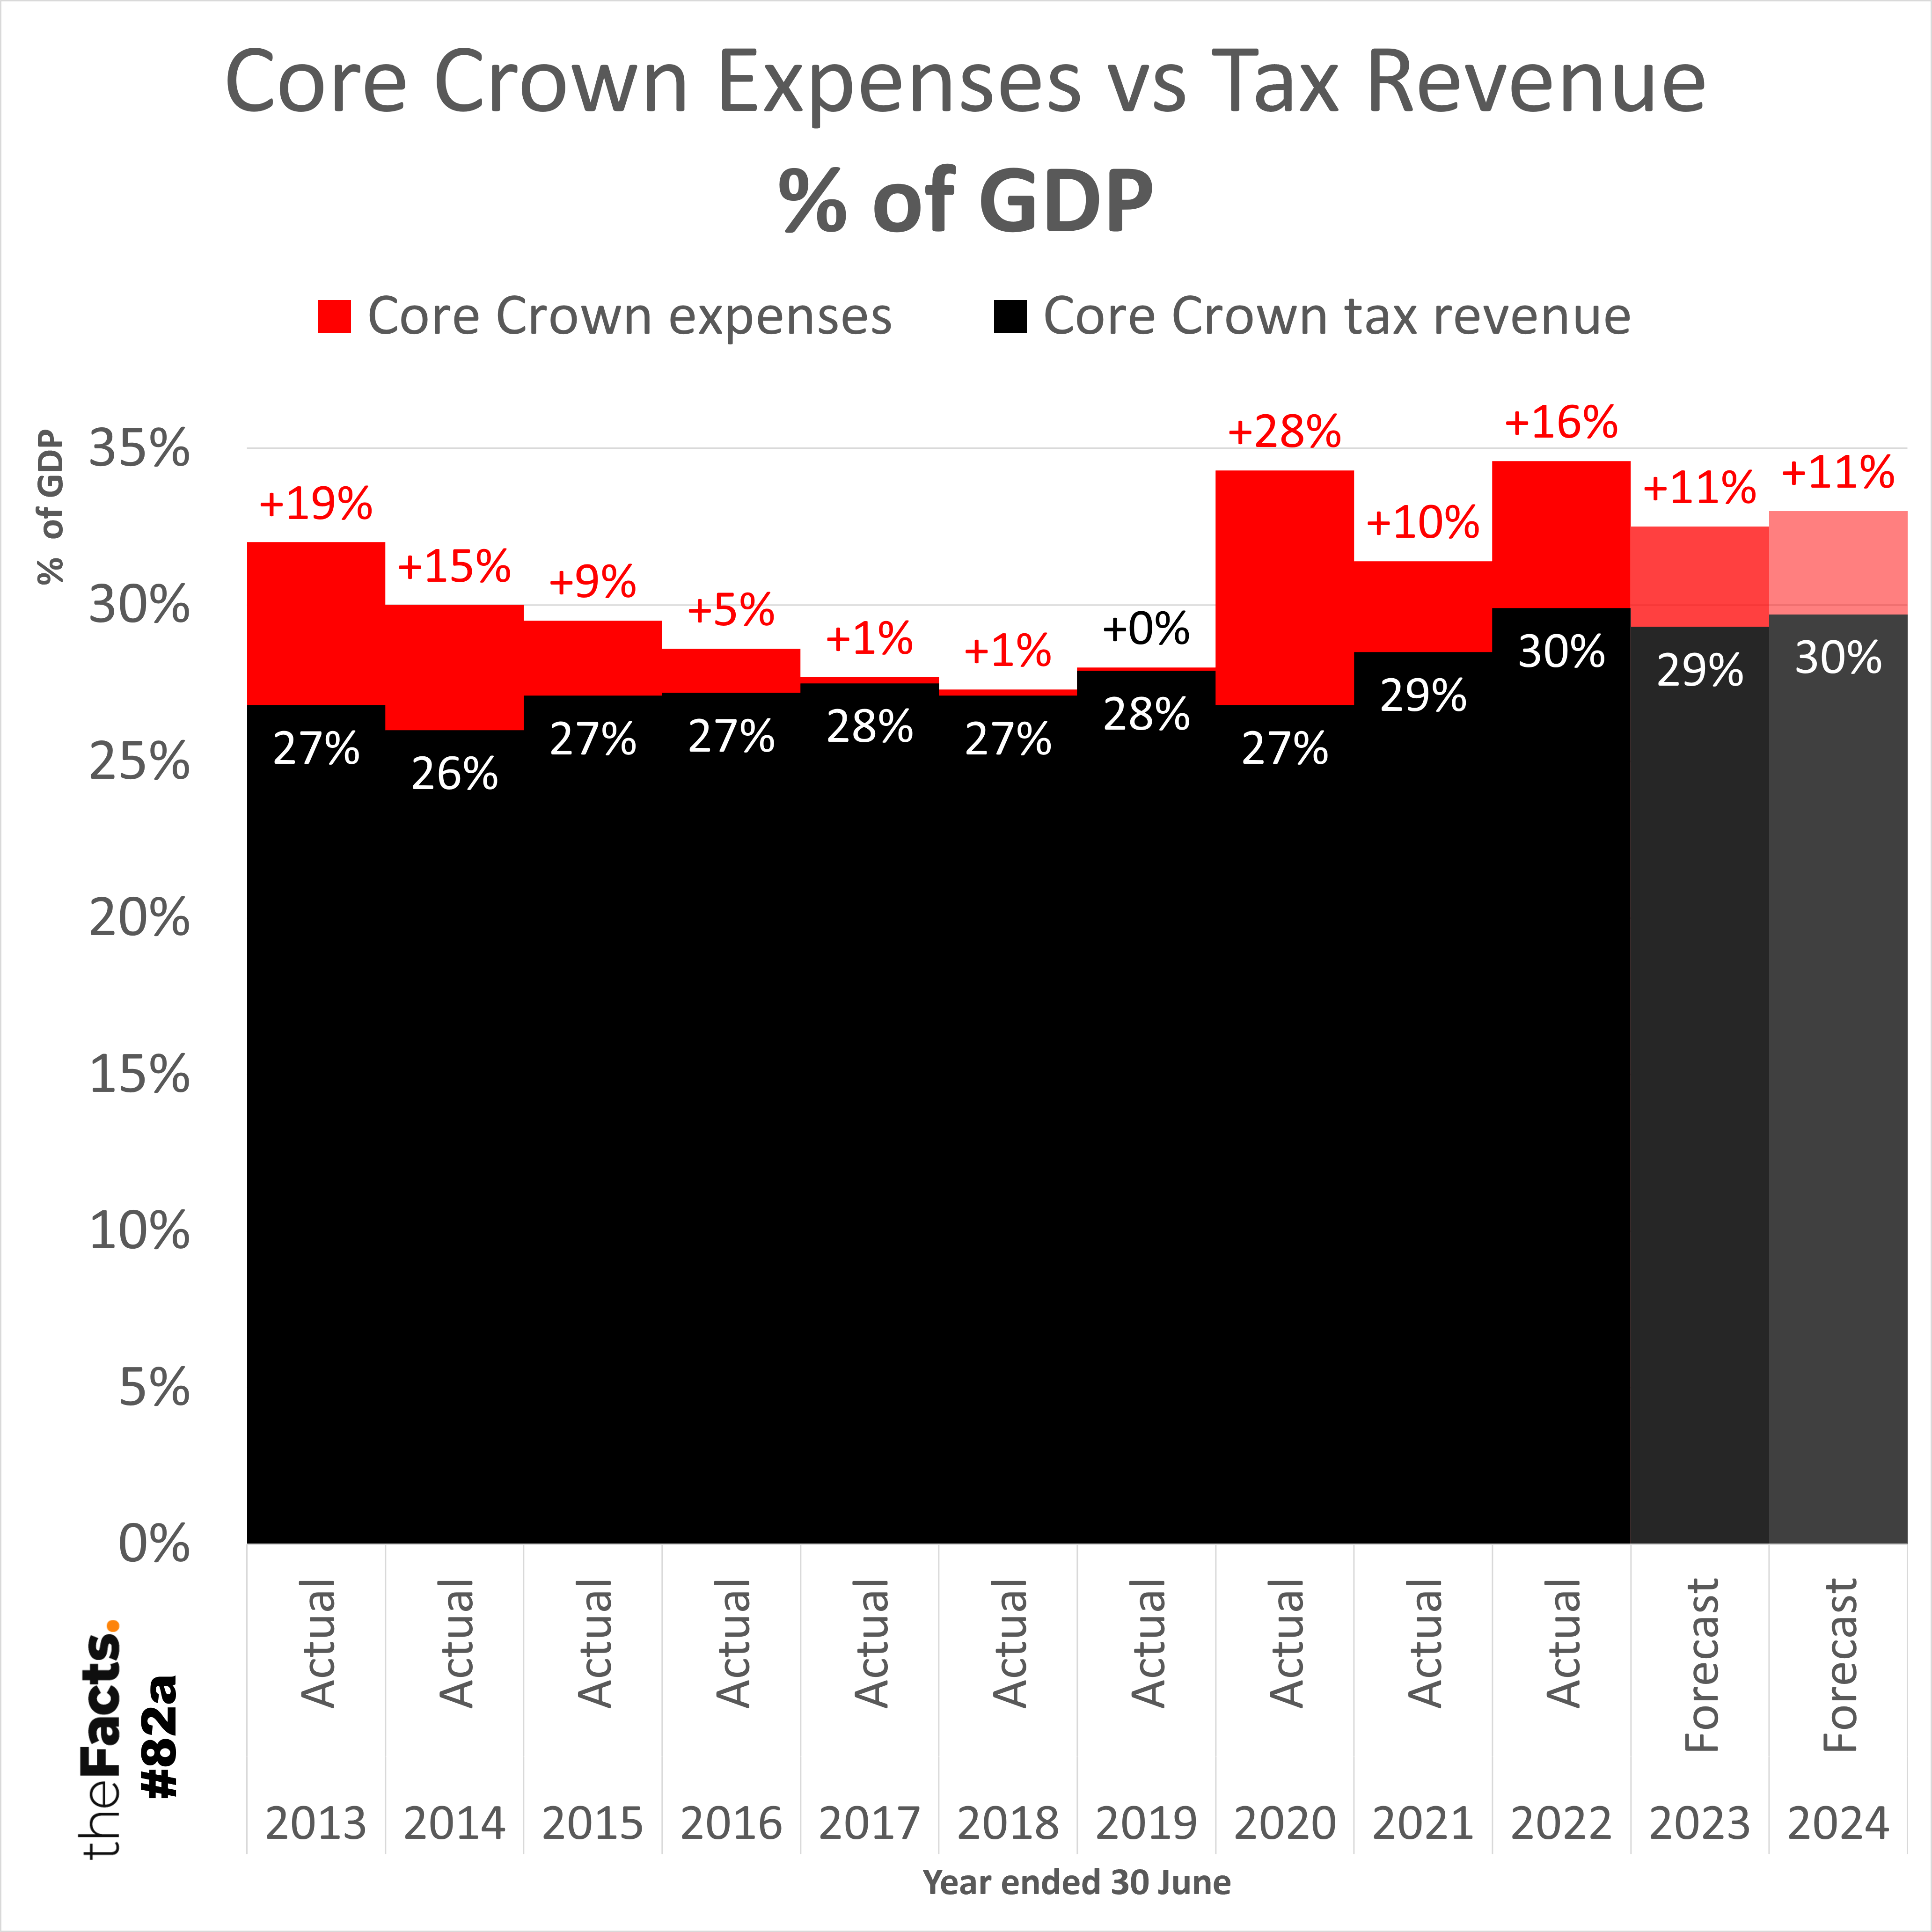
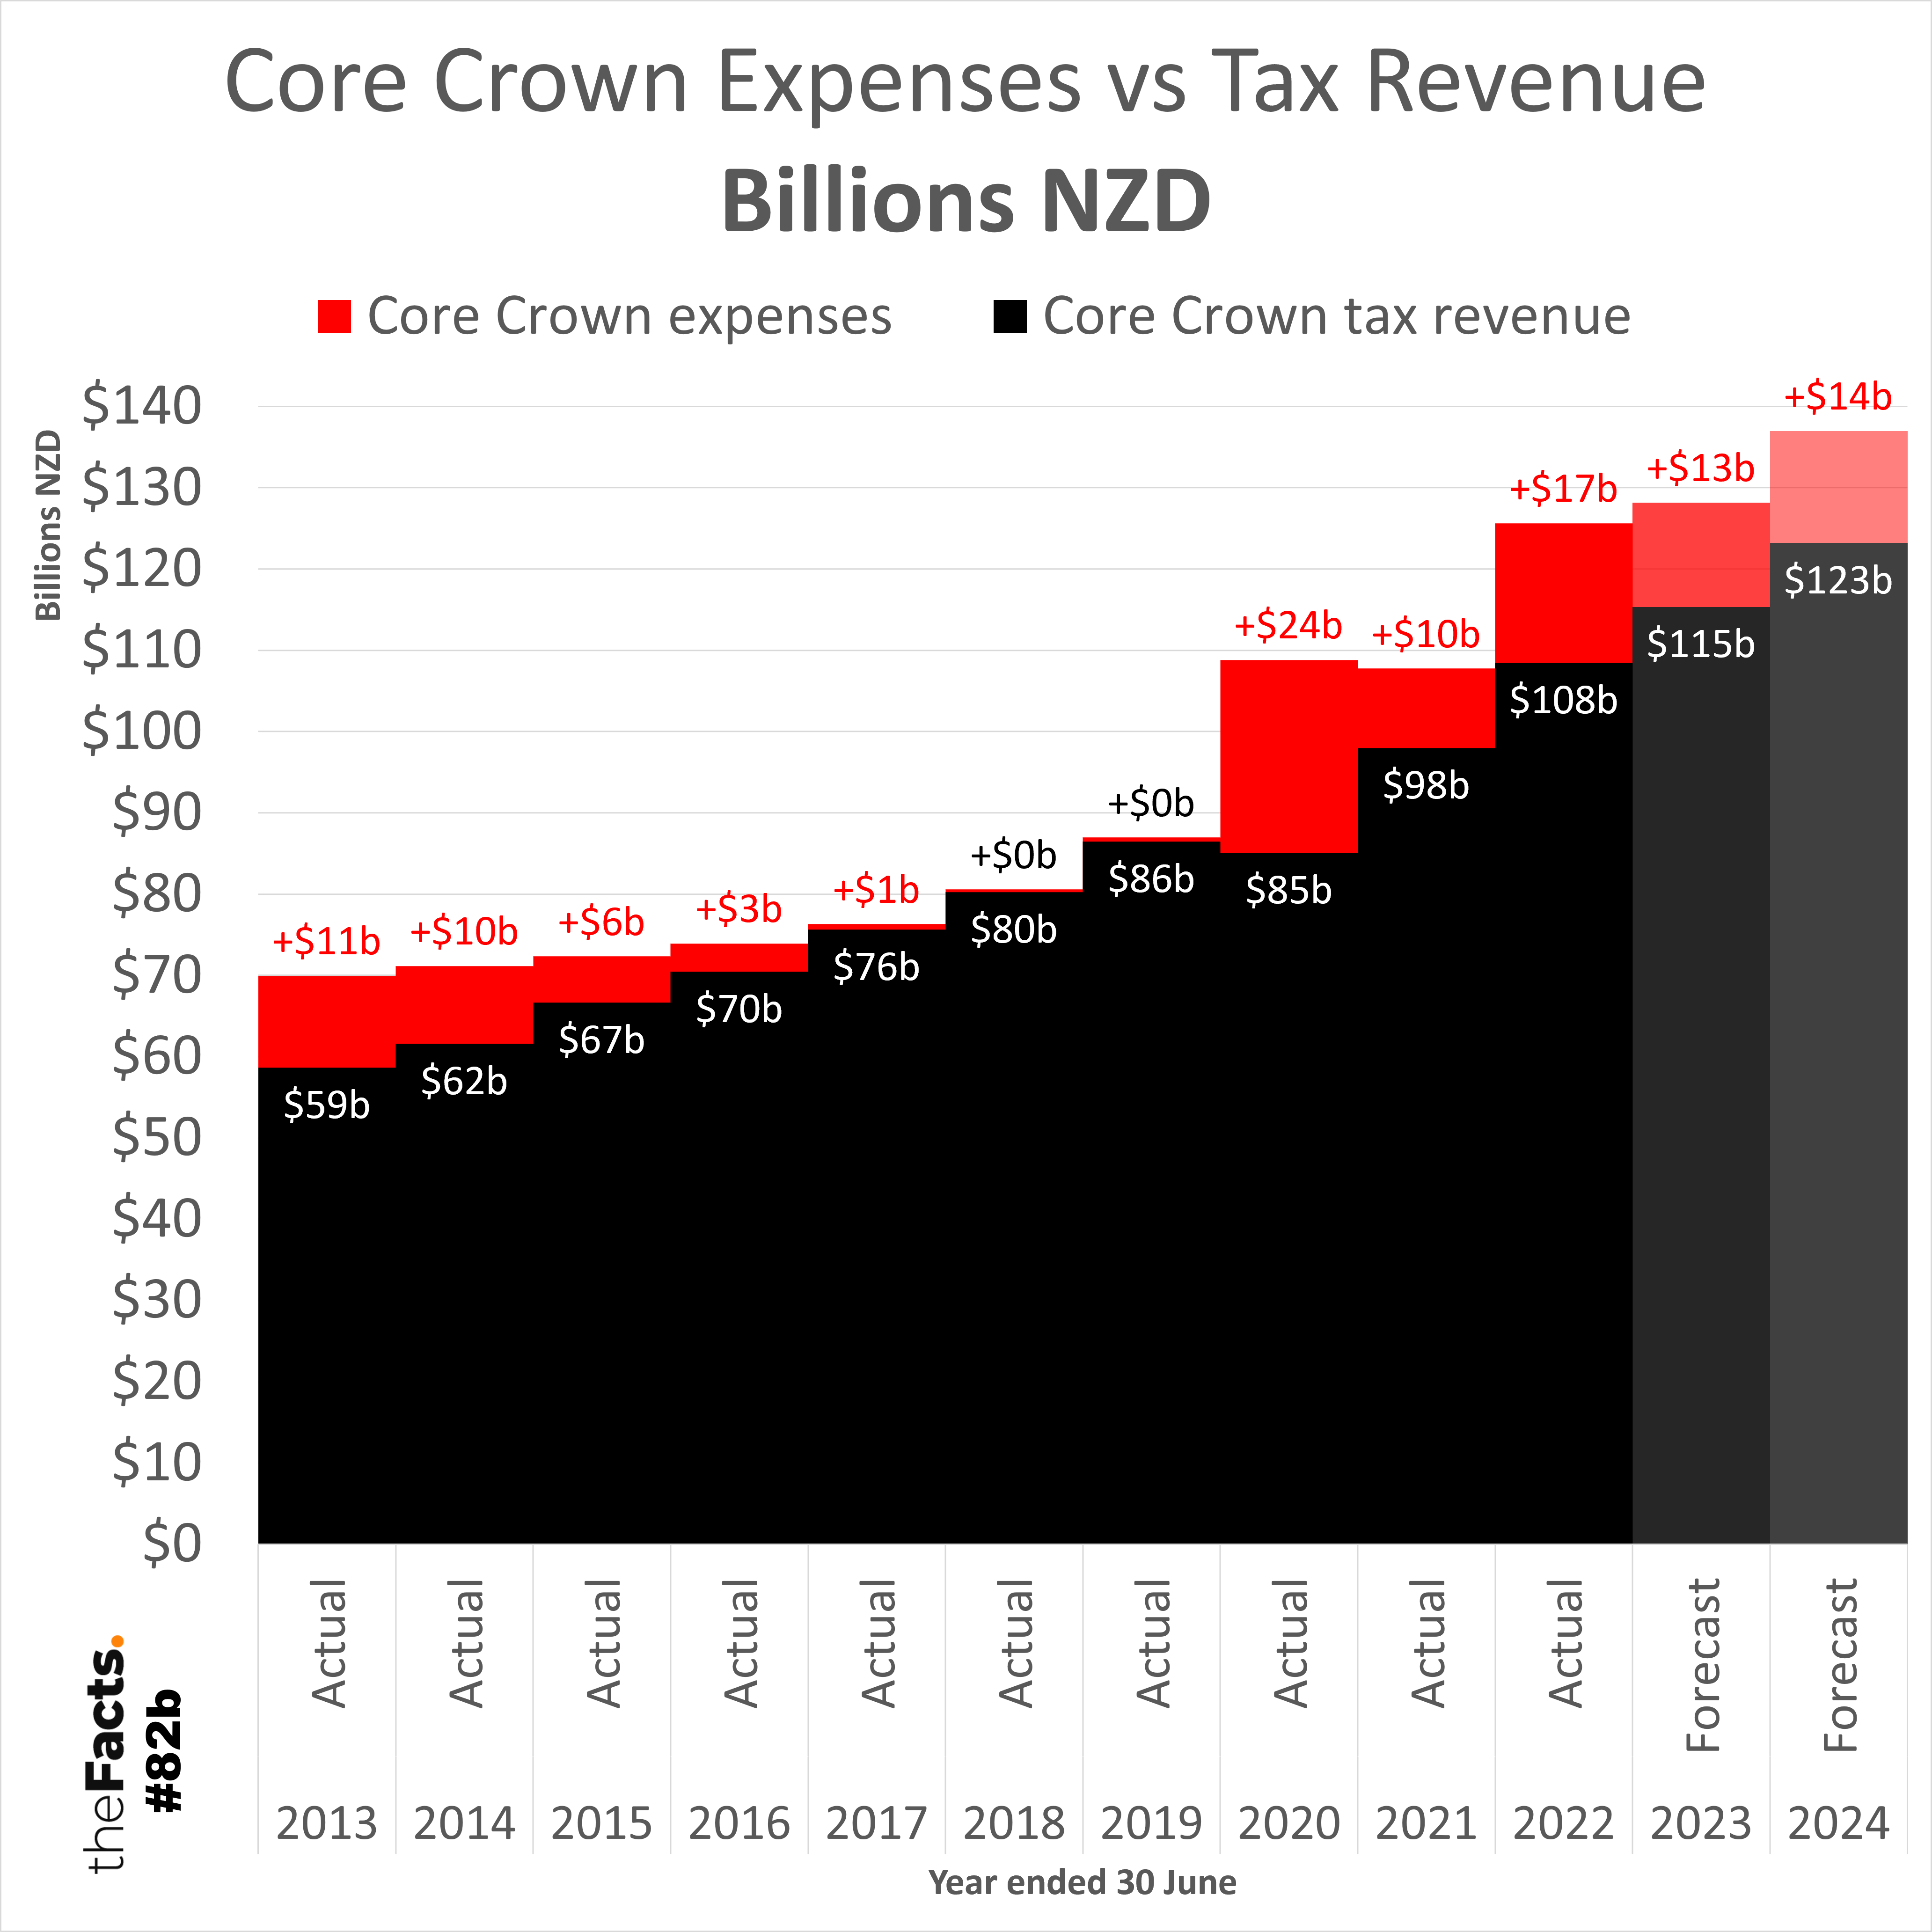
- We have chosen today to show Core Crown expenses against Core Crown tax revenue since they balanced each other through the 2017-2019 years, and some argue that this close alignment should continue under normal fiscal management years, with any surplus Core Crown revenues being used for paying down debt, capital expenditure, e.g. hospital and roading infrastructure, or keeping as investments/reserves for future natural or human disasters. You can also compare Core Crown expenses vs total Core Crown revenue, and we have sought the advice of Treasury for when this would be the more appropriate measure.
- Since the 2023 June Financial Year is almost complete, the 2023 Forecast figures are based mostly on actual data. We have left it labeled as “Forecast” rather than breaking out the actual vs forecast numbers, and shown it in an almost-black shade.
- % of GDP is generally considered the better way to measure government tax revenue and spending as it accounts for inflation, population, and economy changes.
KEY INSIGHTS
- Core Crown tax revenue:
- Is now ~30% of GDP (29.9% in 2022 actual, 29.3% in 2023 forecast, 29.7% in 2024 forecast)
- Is up ~9% on pre-Covid taxation rates as a proportion of GDP, or 2.5 percentage points, (2013-2019 average = 27.1%, 2022-2024 average = 29.6%)
- Has almost doubled in 10 years in dollar terms ($58.7b in 2013 vs $115.3b in 2023 forecast and $123.2b in 2024 forecast = ~$57-65b more tax)
- Core Crown expenses:
- Were considerably higher than Core Crown tax revenue following:
- the ~2007-2009 GFC and 2010-2011 Christchurch earthquakes
- the global Covid outbreak and lockdowns from 2020
- But were only 1% and $1b higher than tax revenue in the 2017 year following the 14 November 2016 Kaikoura earthquake
- And were only 0-1% and $0-1b higher than tax revenue in the 2018 and 2019 years too
- Have been running 10-28% higher than tax revenue since 2020, contributing further to Government debt
- Remain forecast to stay 11% higher than tax revenue for the full 2023 and 2024 years
- Have almost doubled in 10 years in dollar terms ($70b in 2013 vs $128.2b in 2023 forecast and $137b in 2024 forecast = ~$58-67b more spending)
- Is now ~1/3% of GDP (34.6% in 2022, 32.5% in 2023 forecast, 33.0% in 2024 forecast. Was as low as 27.3% in 2018.)
- Were considerably higher than Core Crown tax revenue following:
KEY QUESTIONS
Q1. Are we happy with the Return on Taxpayer Investment (R.O.T.I.) from this increased tax and spending?
Q2. Are we happy with Core Crown spending sitting 11% higher than tax revenue?
…
Have your say
![]()
![]()
…
Full data analysis
Please contact us if you would like the complete data set and research.
…
Other notes:
- We have led with the % of GDP graph since % of GDP is generally considered the better way to measure government tax revenue and spending as it accounts for inflation, population, and economy changes.
- We’ve shown both % and $ values in dual graphs to help New Zealanders better understand Crown/Government taxation and spending relative to GDP. Combining these into one graph, as we have done in the past, hindered comprehension for some audiences, so we felt it was best to split them apart.
- Actual data from before 2013 was not included in this data set but can be accessed through previous Budget and Economic Fiscal Updates (BEFU). We have asked Treasury if a single time-series data set exists.
- Since the 2023 June Financial Year is almost complete, the 2023 Forecast figures are based mostly on actual data. We have left it labeled as “Forecast” rather than breaking out the actual vs forecast numbers, and shown it in an almost-black shade.
- We have chosen to show out to the 2024 Forecast figures for two reasons:
- Previous forecasts have proven to be very inaccurate.
- There is a general election on October 14 which could change Crown taxation revenue, spending, and debt levels significantly.
- We chose the same black and red colour scheme as used on the Government’s own releases. See https://budget.govt.nz/budget/2023/wellbeing/fiscal-strategy/debt-measure.htm#:~:text=The%20Treasury’s%20Budget%20Update%20shows,than%20forecast%20at%20Budget%202021.
- Additional notes from Treasury can be found in the data source pages below.
- All numbers are provisional and subject to revision.
Thank you to the Factors who helped pull this together.
…
SOURCE:
- https://www.treasury.govt.nz/publications/efu/budget-economic-and-fiscal-update-2023 and then Budget Economic and Fiscal Update 2023 – Charts and Data and then go to right to the second to last worksheet called “Time Series Fiscal”
Data published by The Treasury
(c) Crown Copyright
Licensed for use under the creative commons attribution licence (BY) 4.0
…
Did we make a mistake, or have you got smarter data? Let us know.