KEY INSIGHTS TABLE
| Demographic | Violent crime proceedings | % of violent crime | % of population | Adj % of population |
|---|---|---|---|---|
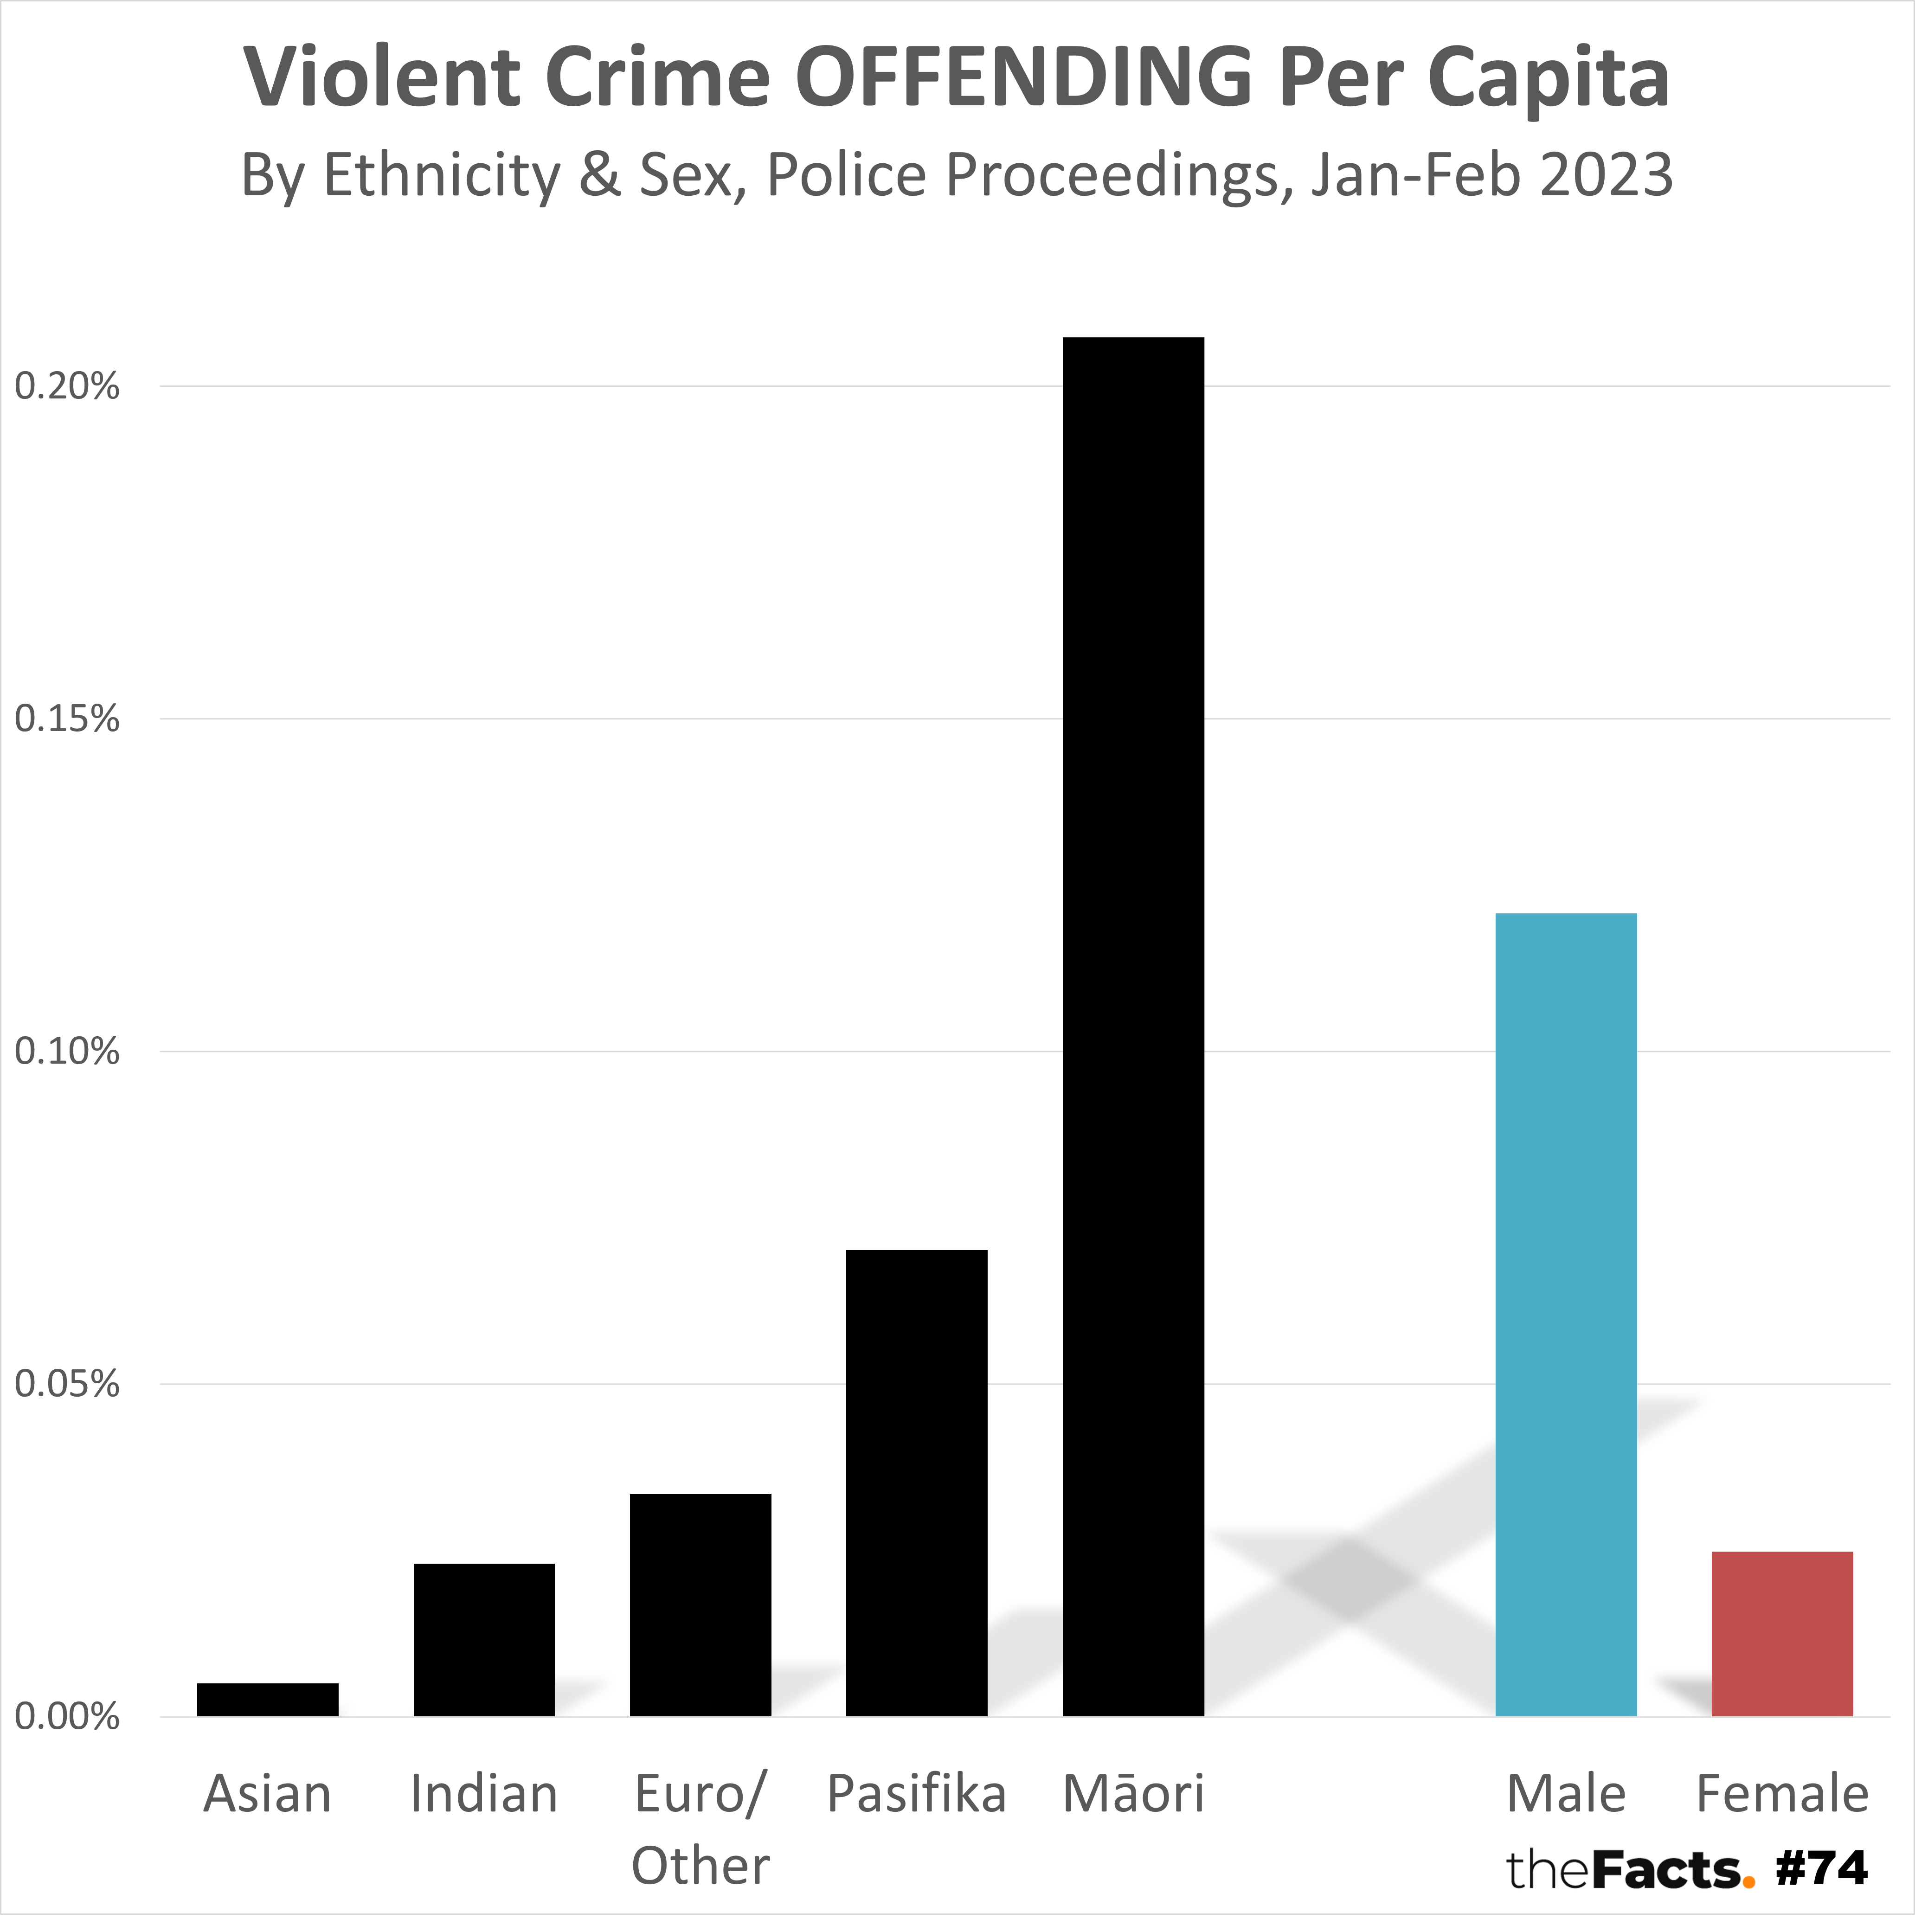
| Asian | 28 | 0.7% | 10.7% | 9.3% |
| Indian | 71 | 1.9% | 6.0% | 5.2% |
| European and Other | 1,233 | 32.8% | 71.5% | 62.2% |
| Pasifika | 329 | 8.7% | 9.1% | 7.9% |
| Māori | 1,879 | 49.9% | 17.6% | 15.3% |
| Ethnicity not stated | 224 | 6.0% | – | – |
| Male | 3,114 | 82.7% | – | 49.6% |
| Female | 650 | 17.3% | – | 50.4% |
| TOTAL | 3,764 | 100% | 115% | 100% |
| Demographic | Violent crime proceedings | % of violent crime | % of population | Adj % of population |
|---|---|---|---|---|
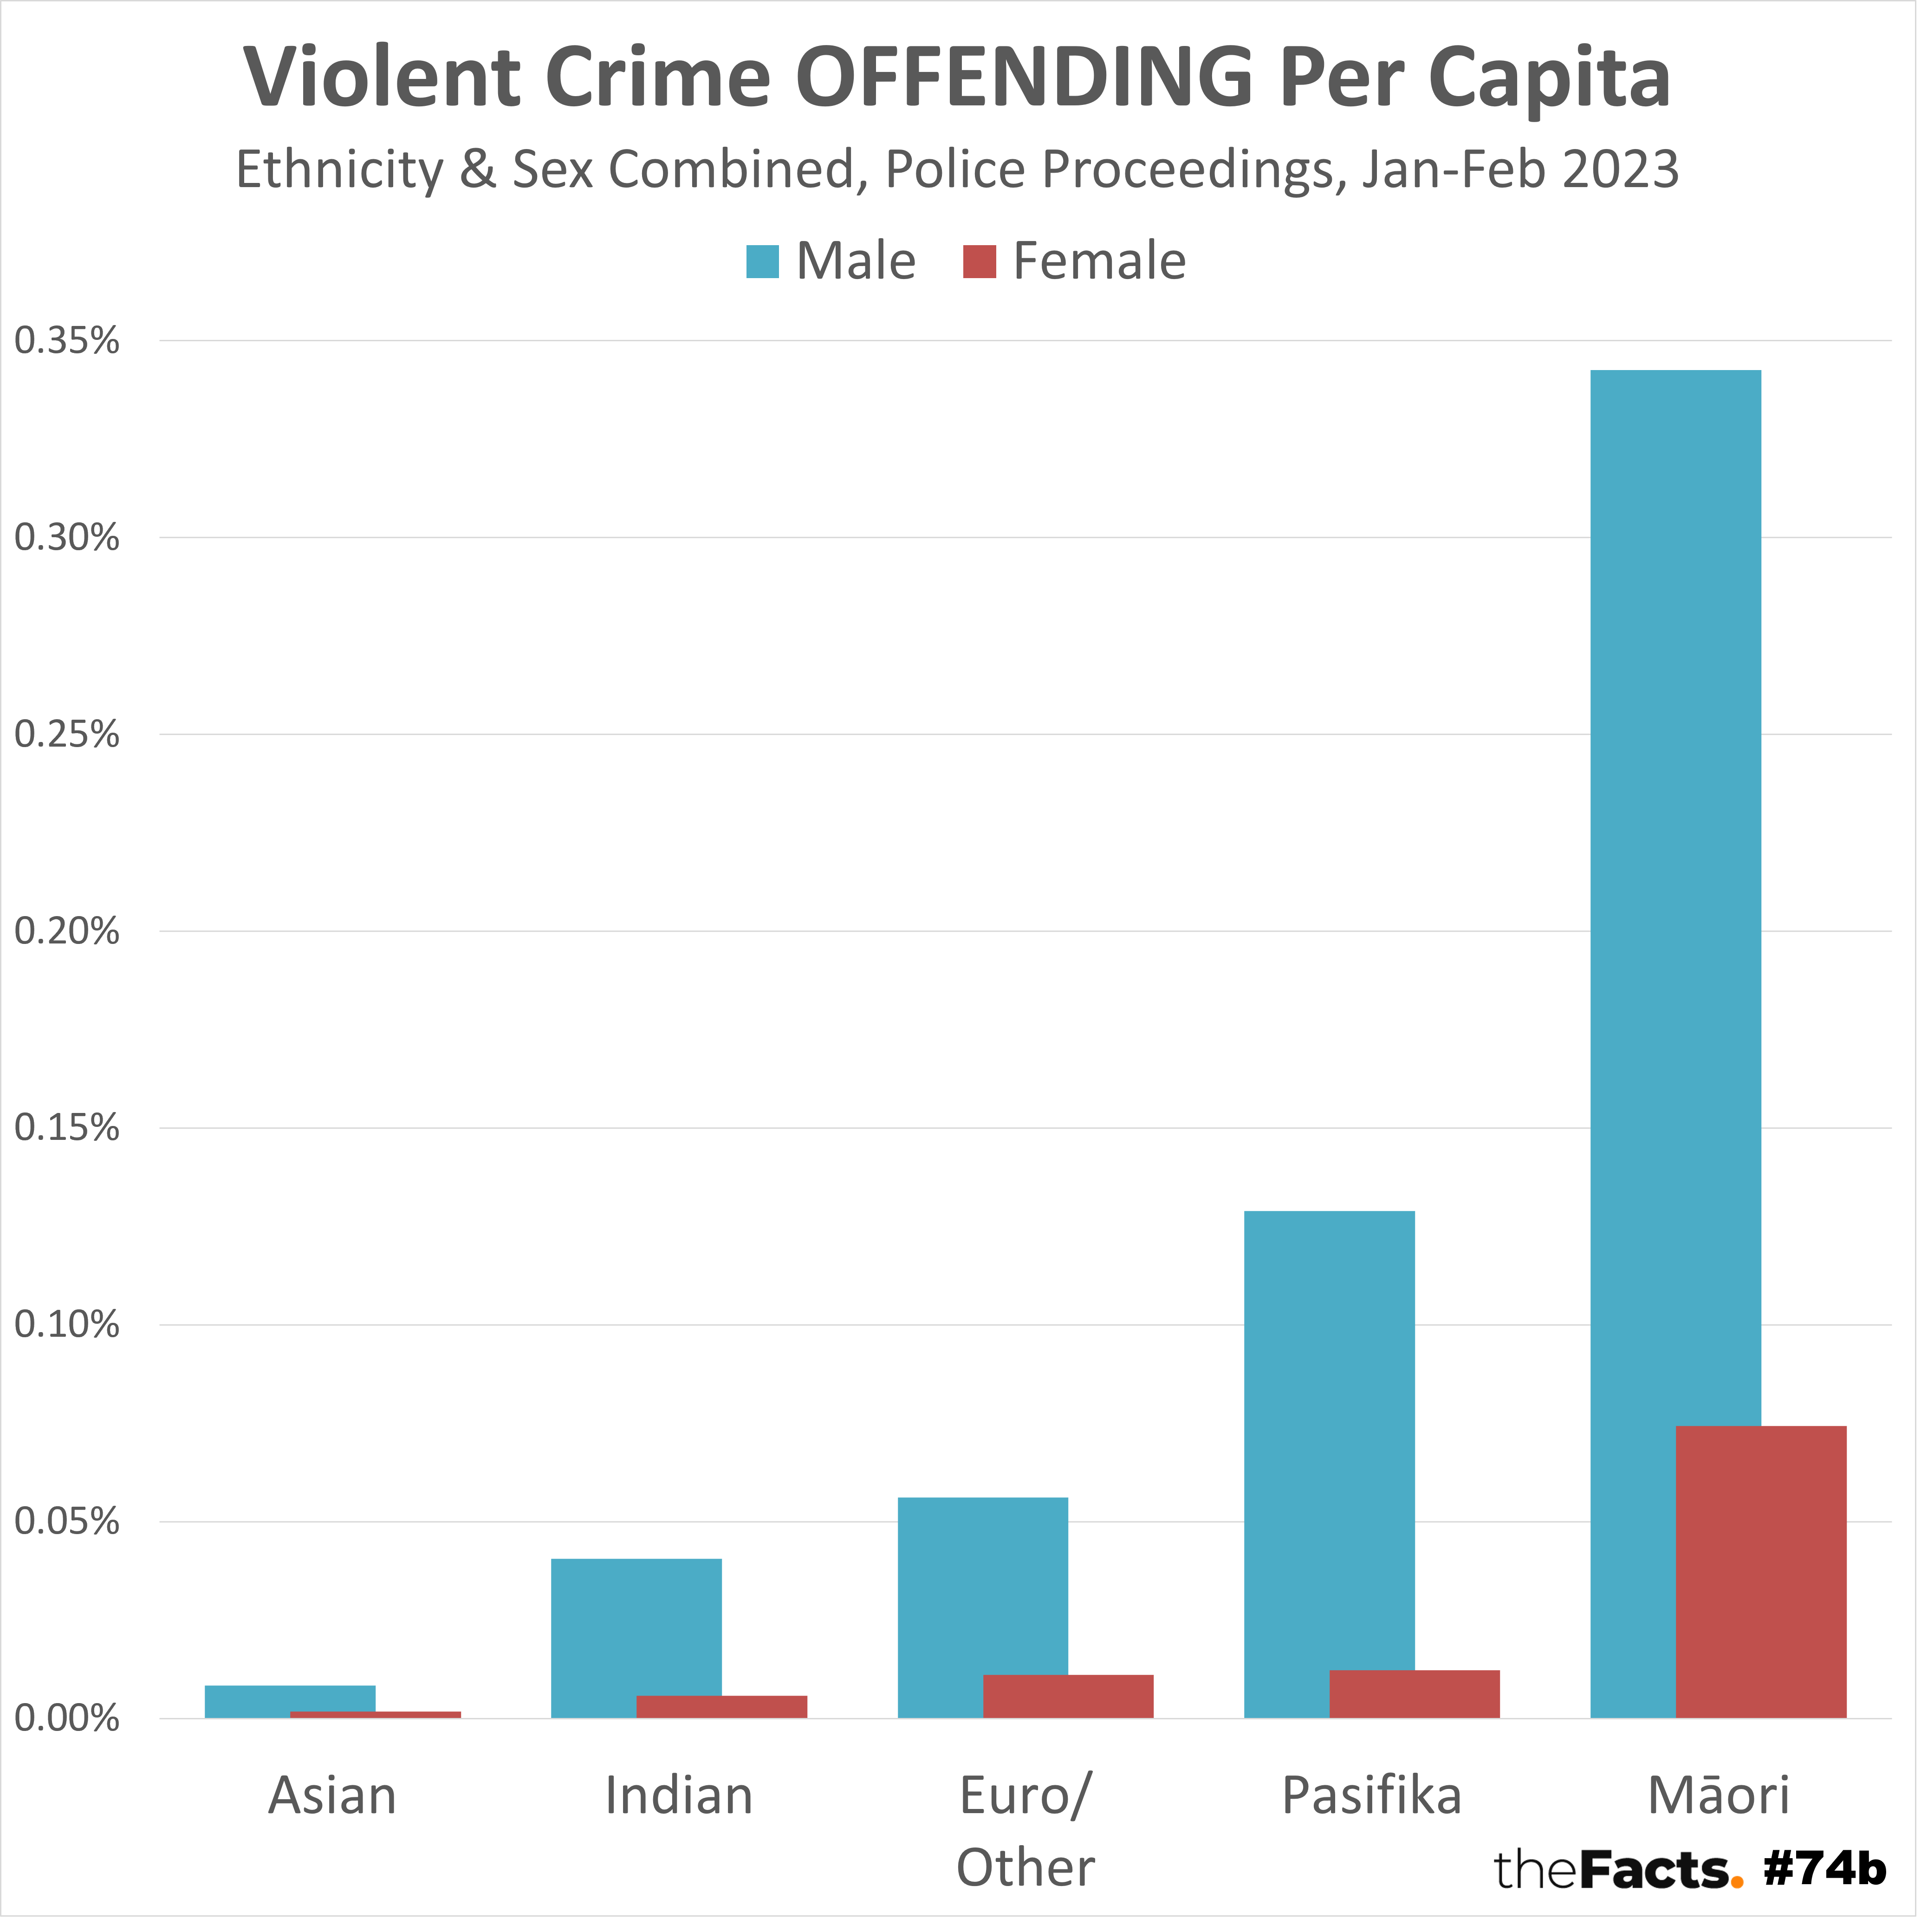
| Asian male | 23 | 0.6% | 5.3% | 4.6% |
| Asian female | 5 | 0.1% | 5.4% | 4.7% |
| Indian male | 62 | 1.6% | 3.0% | 2.6% |
| Indian female | 9 | 0.2% | 3.0% | 2.6% |
| European and Other male | 1,027 | 27.3% | 35.5% | 30.9% |
| European and Other female | 206 | 5.5% | 36.0% | 31.3% |
| Pasifika male | 300 | 8.0% | 4.5% | 3.9% |
| Pasifika female | 29 | 0.8% | 4.6% | 4.0% |
| Maori male | 1,540 | 40.9% | 8.7% | 7.6% |
| Maori female | 339 | 9.0% | 8.9% | 7.7% |
| Ethnicity not stated male | 162 | 4.3% | – | – |
| Ethnicity not stated female | 62 | 1.6% | – | – |
| TOTAL | 3,764 | 100% | 115% | 100% |
VIOLENT OFFENCES OVER THIS PERIOD
See notes for how the classification of ‘violent crime’ was determined.
- Acts Intended to Cause Injury (Assault) = 2,920
- Breach of Violence Order = 303
- Sexual Assault = 241
- Aggravated Robbery = 239
- Abduction and Kidnapping = 45
- Murder = 12
- Attempted Murder = 2
- Cruelty to Animals = 2
- TOTAL = 3,764
KEY QUESTIONS
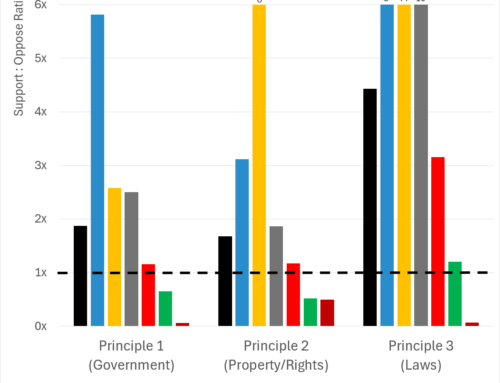
- How do we reduce the amount of violent crime in New Zealand, especially from overrepresented demographic groups like Māori and males?
- What should happen to Marama Davidson, Minister of Prevention of Family and Sexual Violence, after her racist and disinformative public comment, “I am the prevention violence minister, and I know who causes violence in the world – it is white cis men. That is white cis men who cause violence in the world.”
…
Have your say
LinkedIn
And this second post too.
…
Full data analysis
Please contact us if you would like the complete research.
…
Sex notes:
- 100% of violent crime proceedings over this period had a sex = male or sex = female listed against each case. There were no instances of sex not specified or sex not stated.
…
Ethnicity notes:
- ‘Ethnicity not stated’ violent offence proceedings have NOT been proportionally reallocated across the ethnicity groups in the graph. If it was, the %s of violent crime will be 6% higher for each ethnic group. For relativity and comparison, we felt it was best to stick with the ethnicities that were clearly labeled/known rather than evenly redistribute them. We have asked the NZ Police for comment on this point.
- The NZ Police only record a single ethnicity, whereas Stats NZ allows individuals to be counted multiple times across different ethnicities, which is why there is a 115% population total and why we have provided an adjusted population column.
- The NZ Police split ‘Asian’ and ‘Indian’ ethnicities out. Stats NZ combines ‘Indian’ within the ‘Asian’ count, but also provides sub-category counts.
- The NZ Police split ‘European’ and ‘Other’ out. Stats NZ combines ‘European’ and ‘Other’ in their ethnicity population projections and call this ‘European and Other (including New Zealander)’. Their explanation is:
“The ‘other’ group is very small and made up primarily of people who identify as ‘New Zealander‘. In 2006, there was heightened media presentation of the option to report as a ‘New Zealander’ which resulted in a significant increase in these responses. We observed in the data the number of people who identified as European decreased, and the size of the other category increased. To maintain consistency these were grouped together. In addition, the ‘other’ group is too small to project alone and thus needs to be grouped for projections purposes.
For the estimates, this data can be split out for 2018. However, this is classified as a customised data request so there will be a charge. For the projections, given the way they are produced, splitting the data is not feasible.” - The NZ Police puts ‘MELAA’ (Middle Eastern/Latin American/African) into ‘Other’. Stats NZ splits them out into their own ethnic category.
- Due to the two points above, we have had to combine ‘European’, ‘MELAA’, and ‘Other’ into ‘Euro/Other’.
- NZ Police use the ethnicity labels ‘Maori’, ‘Pacific Island’, ‘European’, and ‘Other’ in their reporting. Stats NZ use ‘Māori’, ‘Pacific’, and ‘European or Other (including New Zealander)’. We have used ‘Māori’, ‘Pasifika’, ‘Euro/Other’.
- See https://datainfoplus.stats.govt.nz/item/nz.govt.stats/d0dec6b1-d64d-4359-aa97-cd6ff746ad99/1 for more information on how Stats NZ create their National Ethnic Population Projections.
- Stats NZ’s National Ethnic Population Projections are not broken down by Sex, so we have used the national averages of 49.6% male and 50.4% female for each ethnic group breakdown by Sex.
Other notes:
- All available information has been published.
- We selected 3 months of proceedings (one quarter of the year) as we felt that was the fairest measure of current crime rates. One quarter of a year is also commonly used for other key national metrics. However, this actually only spat out 2 months of data for January and February 2023. As such, we’ve used that 2023 data only.
- March crime data was not available when we did this research on April 3rd and 4th.
- We used September and December 2022 male and female population estimates to project March and June 2023 male and female population estimates. We then used that June 2023 figure to be consistent with the June 2023 ethnicity population projections. We have not adjusted these population figures back to the January-February proceedings period as a) we felt it was best to have a consistent June 2023 population count for both ethnicity and sex and b) the per capita figures will not change significantly and c) it is the relativity between demographic groups that is the key insight.
- We received NZ Police input to verify that our selection of ANZSOC codes representative of ‘violent crime’ were as fair and accurate as possible. We also cross-checked https://www.stuff.co.nz/national/the-whole-truth/130965380/the-whole-truth-has-violent-crime-gone-up-under-labour and https://www.kiwiblog.co.nz/2023/03/i_am_the_prevention_violence_minister_and_i_know_who_causes_violence_in_the_world_and_its_white_cis_men.html articles. Please do challenge us if you think there is a better classification.
- Crime definitions can be found via: https://www.abs.gov.au/statistics/classifications/australian-and-new-zealand-standard-offence-classification-anzsoc/latest-release.
- There is also a useful aggravated robbery definition on https://www.police.govt.nz/advice-services/businesses-and-organisations/retail-crime-prevention-hub/victims-ram-raids-aggravated-robbery.
- Not all crime is reported.
- We chose black to represent the ethnicity bars in the graph as this is New Zealand’s national colour. We choose blue and red for the male and female bars in the graph as these are commonly used to represent each sex so help quick audience interpretation.
- All numbers are provisional and subject to revision.
Thank you to the Factors who helped pull this together.
…
SOURCES:
- Proceedings (offender demographics) = https://www.police.govt.nz/about-us/publications-statistics/data-and-statistics/policedatanz/proceedings-offender-demographics (use the Demographics tab and click on ANZSOC codes to expand and select the variables you would like)
Data published by New Zealand Police
(c) Crown Copyright
Licensed for use under the creative commons attribution licence (BY) 4.0
- Ethnicity population estimates = https://www.stats.govt.nz/information-releases/national-ethnic-population-projections-2018base2043-update/
- Sex population estimates = https://infoshare.stats.govt.nz/ (go to Population > Population Estimates – DPE > Estimated Resident Population by Age and Sex (1991+) (Annual-Dec))
This work is based on/includes Stats NZ’s data which are licensed by Stats NZ for reuse under the Creative Commons Attribution 4.0 International licence.
…
Did we make a mistake, or have you got smarter data? Let us know.