KEY QUESTIONS
- What can men’s rugby learn from the women’s game?
- What can women’s rugby learn from the men’s game?
- Is it time to ban rolling mauls as a try-scoring technique?
- Should penalty kicks be worth fewer points, or tries worth more points?
(There wasn’t a single penalty goal kicked in the women’s final) - Should the game modify the rules to encourage more running and less kicking/set-pieces?
…
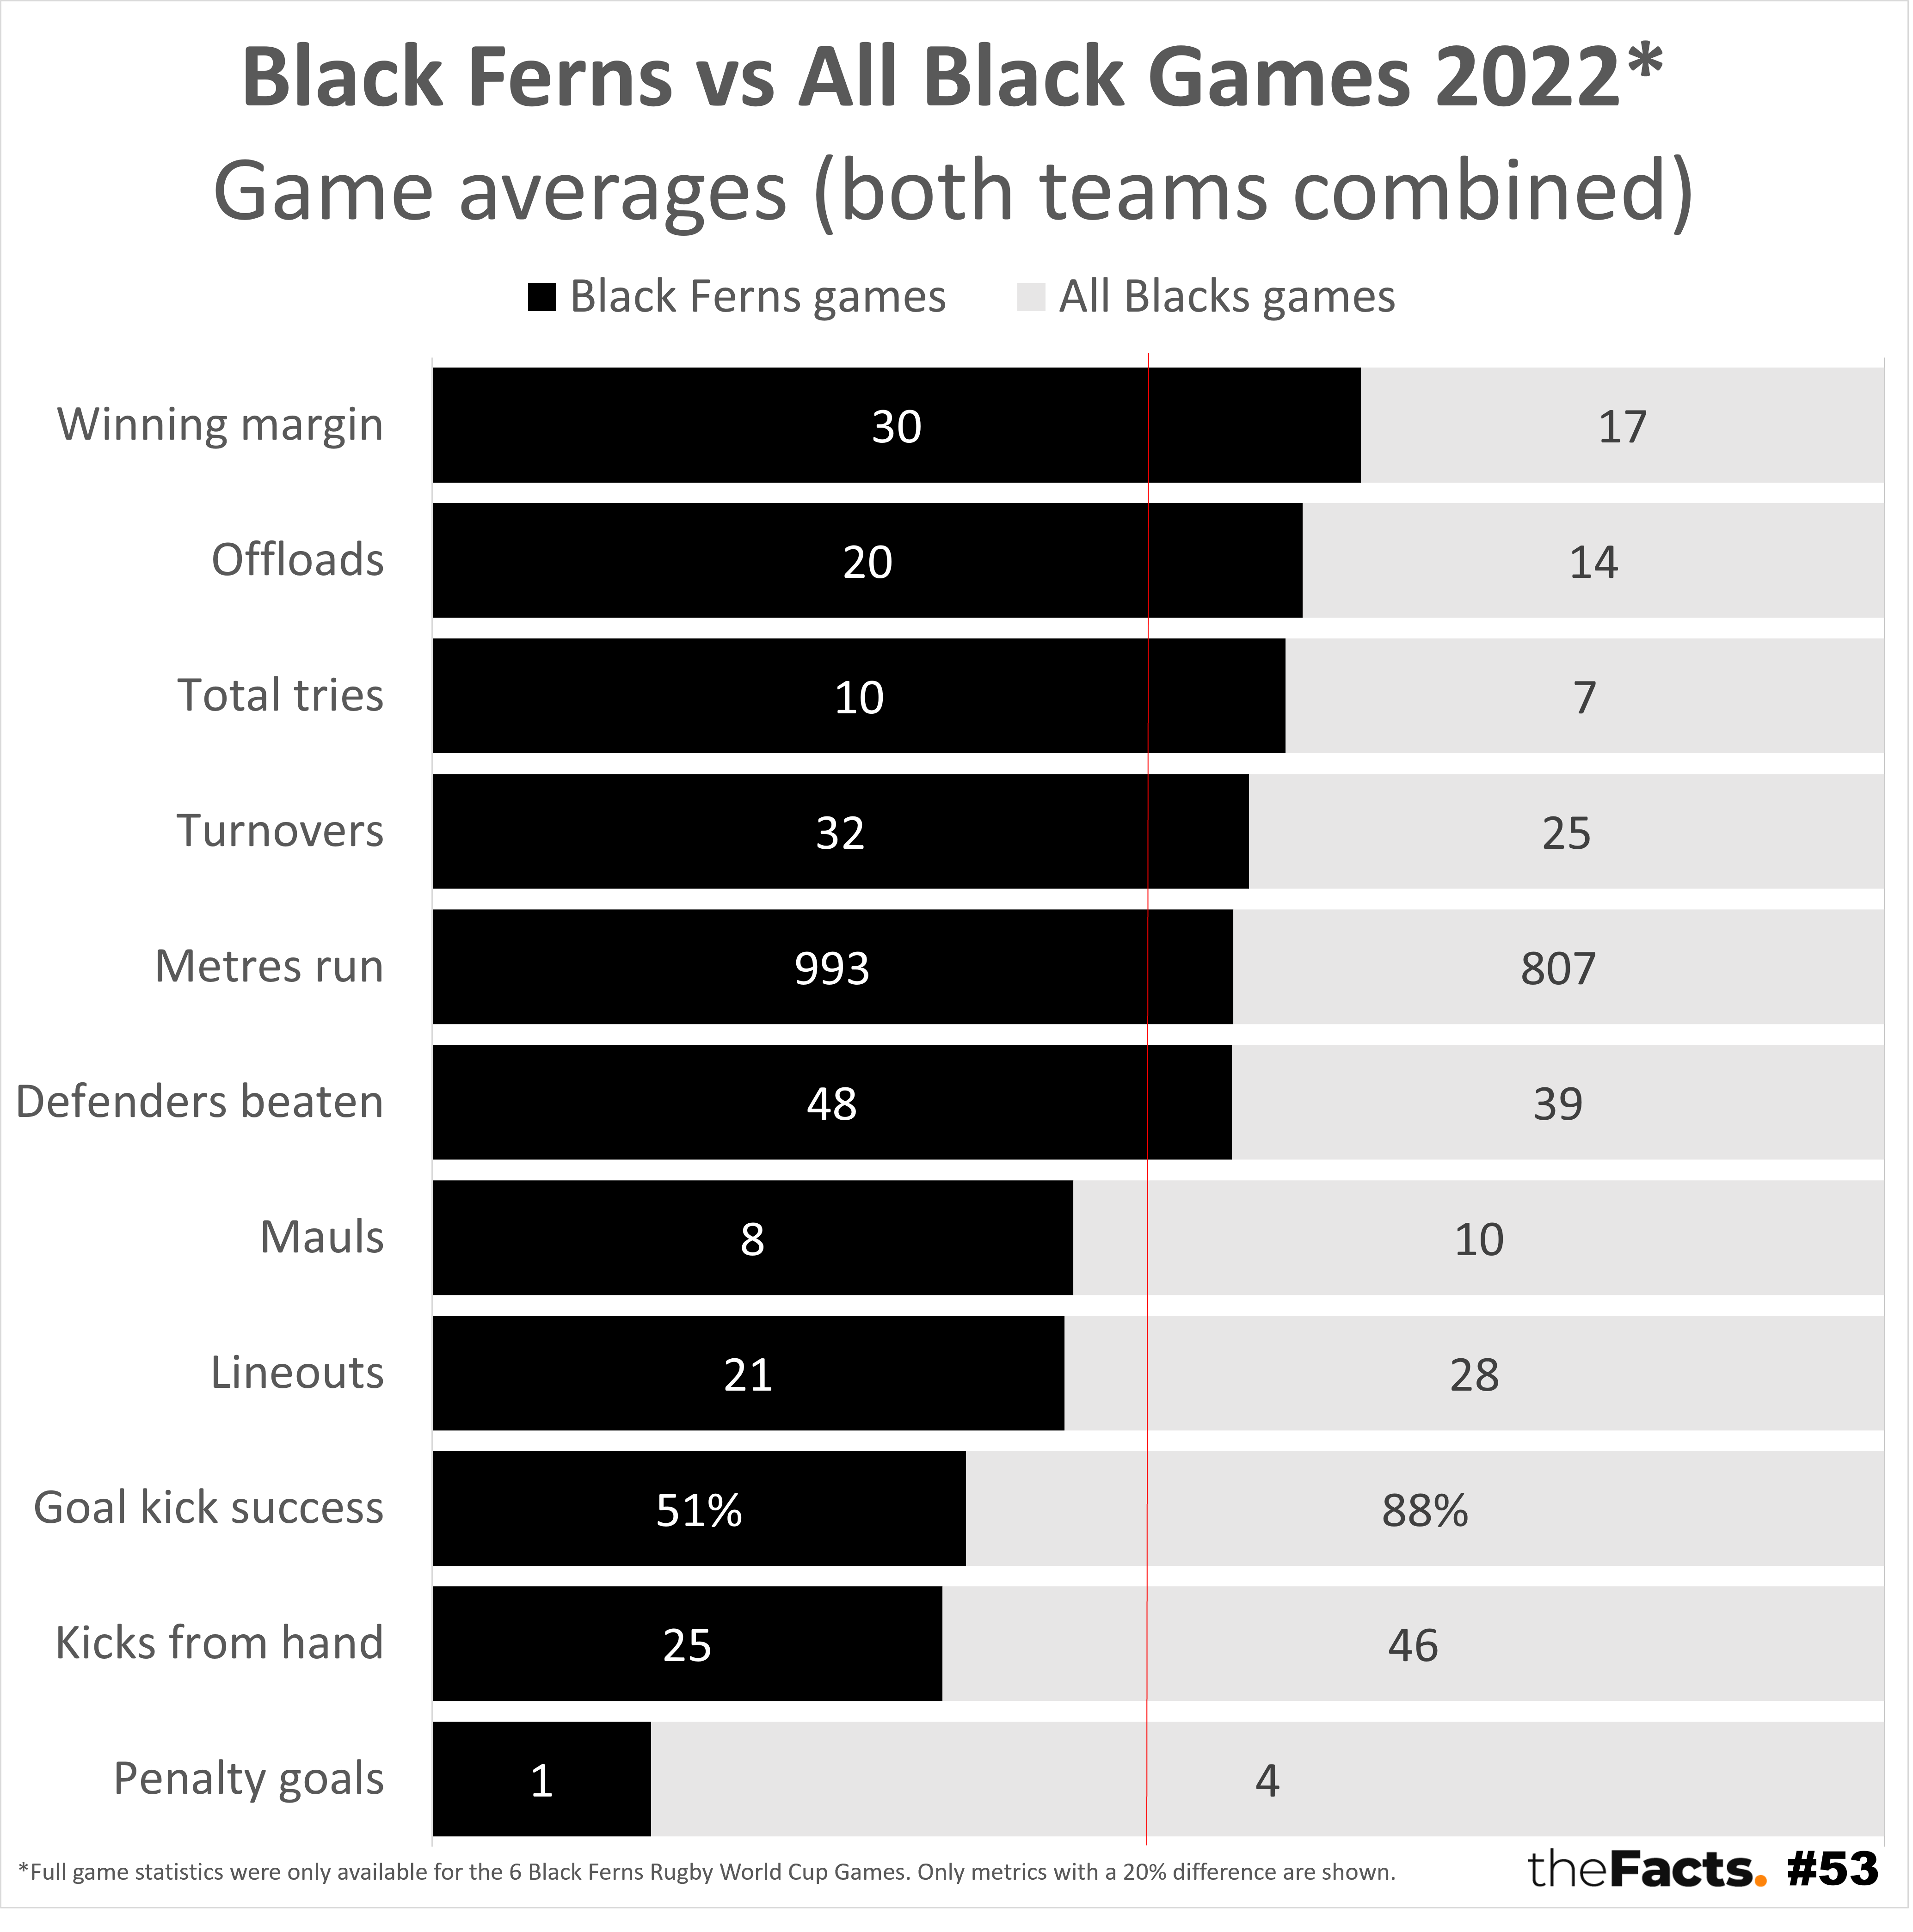
FULL DATA TABLE
Shown in the order presented on ESPN’s statistics pages:
| Statistic | Black Ferns games | All Blacks games | % difference vs ABs games |
|---|---|---|---|
| Opposition points | 14.5 | 23.3 | -38% |
| NZ Points | 44.7 | 32.9 | 36% |
| Winning margin | 30.2 | 17.0 | 77% |
| Total points | 59.2 | 56.2 | 5% |
| Tries | 9.5 | 6.7 | 43% |
| Penalty goals | 0.7 | 3.8 | -82% |
| Kick % success | 51% | 88% | -42% |
| Metres run | 992.5 | 806.7 | 23% |
| Kicks from hand | 24.7 | 45.5 | -46% |
| Passes | 302.8 | 287.2 | 5% |
| Runs | 238.0 | 214.2 | 11% |
| Clean breaks | 10.7 | 9.5 | 12% |
| Defenders beaten | 47.8 | 39.0 | 23% |
| Offloads | 20.3 | 13.6 | 50% |
| Rucks | 185.0 | 173.6 | 7% |
| Mauls | 8.2 | 10.3 | -21% |
| Turnovers | 31.5 | 24.5 | 29% |
| Scrums | 14.7 | 13.1 | 12% |
| Lineouts | 21.3 | 27.7 | -23% |
| Tackles | 299.0 | 315.3 | -5% |
| Red cards | 0.2 | 0.3 | -33% |
| Yellow cards | 1.7 | 1.5 | 11% |
| Free kicks | 1.5 | 1.3 | 20% |
| Penalties conceded – opposition | 10.2 | 11.3 | -10% |
| Penalties conceded – NZ | 10.2 | 11.7 | -13% |
| Penalties conceded – TOTAL | 20.3 | 22.9 | -11% |
…
Have your say
…
Full data analysis
Please contact us if you would like the full analysis.
…
Notes:
- Statistics overall:
- The only publicly available full-game statistics for the Black Ferns in 2022 were their 6 Rugby World Cup Games. The last full statistics available before this were from the 2018 World Cup.
- As such, we decided to compare 2022 games only. These are also the most recent in our memories.
- All 12 All Blacks games this year up to the game vs Scotland have been analysed.
- We have only shown stats where there was a 20% difference between the Black Ferns’ and All Blacks’ games. The exceptions to this were mostly due to small sample sizes:
- Red Cards which averaged 0.17 (1 in 6 games) for the Black Ferns’ games and 0.25 (3 in 12 games) for the All Blacks’ games.
- Free kicks which averaged 1.5 (9 in 6 games) for the Black Ferns’ games and 1.3 (15 in 12 games) for the All Blacks’ games.
- Opposition points vs NZ points were already largely reflected in the Winning margin stat.
- ESPN statistics:
- Do not show stoppages/the amount of time the ball is in play, or the total duration of each game. We suspect that the men’s games drag out later on average.
- Do not break out handling errors. We suspect these will be included in turnovers.
- Some fans might argue that:
- A smaller winning margin creates a more entertaining game, the Black Ferns played more ‘minnow’ teams in 2022, or that the men’s game is stronger/more competitive amongst more teams.
- More turnovers is less skillful or entertaining.
- More defenders beaten is a reflection of weaker defense.
- Mauls, lineouts, and kicking are important or exciting parts of the game.
- There were 27 lineouts and 18 mauls in the women’s final, but, overall, the women’s game averages fewer lineouts and mauls than the men’s.
- We suspected that there might be a correlation between Penalties conceded and games lost for the All Blacks, but could not find a consistent pattern:
- Gave away 14 penalties vs 10 to Ireland, but won the first game x
- Gave away 14 penalties vs 14 to Ireland, but lost in the second game x
- Gave away 8 penalties vs 10 to Ireland, but lost in the third game x
- Gave away 12 penalties vs 7 to South Africa, and lost in the first game
- Gave away 12 penalties vs 7 to South Africa, but won in the second game x
- Gave away 14 penalties vs 12 to Argentina, and lost in the first game
- Gave away 11 penalties vs 12 to Argentina, and won the second game
- Gave away 13 penalties vs 11 to Australia, but won the first game (due to the controversial time-wasting free-kick at the end)
- Since then, have given away the same amount of penalties or fewer in the last 4 games and won them all against Australia, Japan, Wales, and Scotland.
- We should celebrate both genders’ versions of the games, of course.
- All numbers are provisional and subject to revision.
Thank you to the Factors who helped pull this together.
…
SOURCES:
ESPN Women’s games = https://www.espn.com/rugby/scoreboard/_/league/289237
ESPN Men’s games = https://www.espn.com/rugby/results/_/team/8/
…
Did we make a mistake, or have you got smarter data? Let us know.


