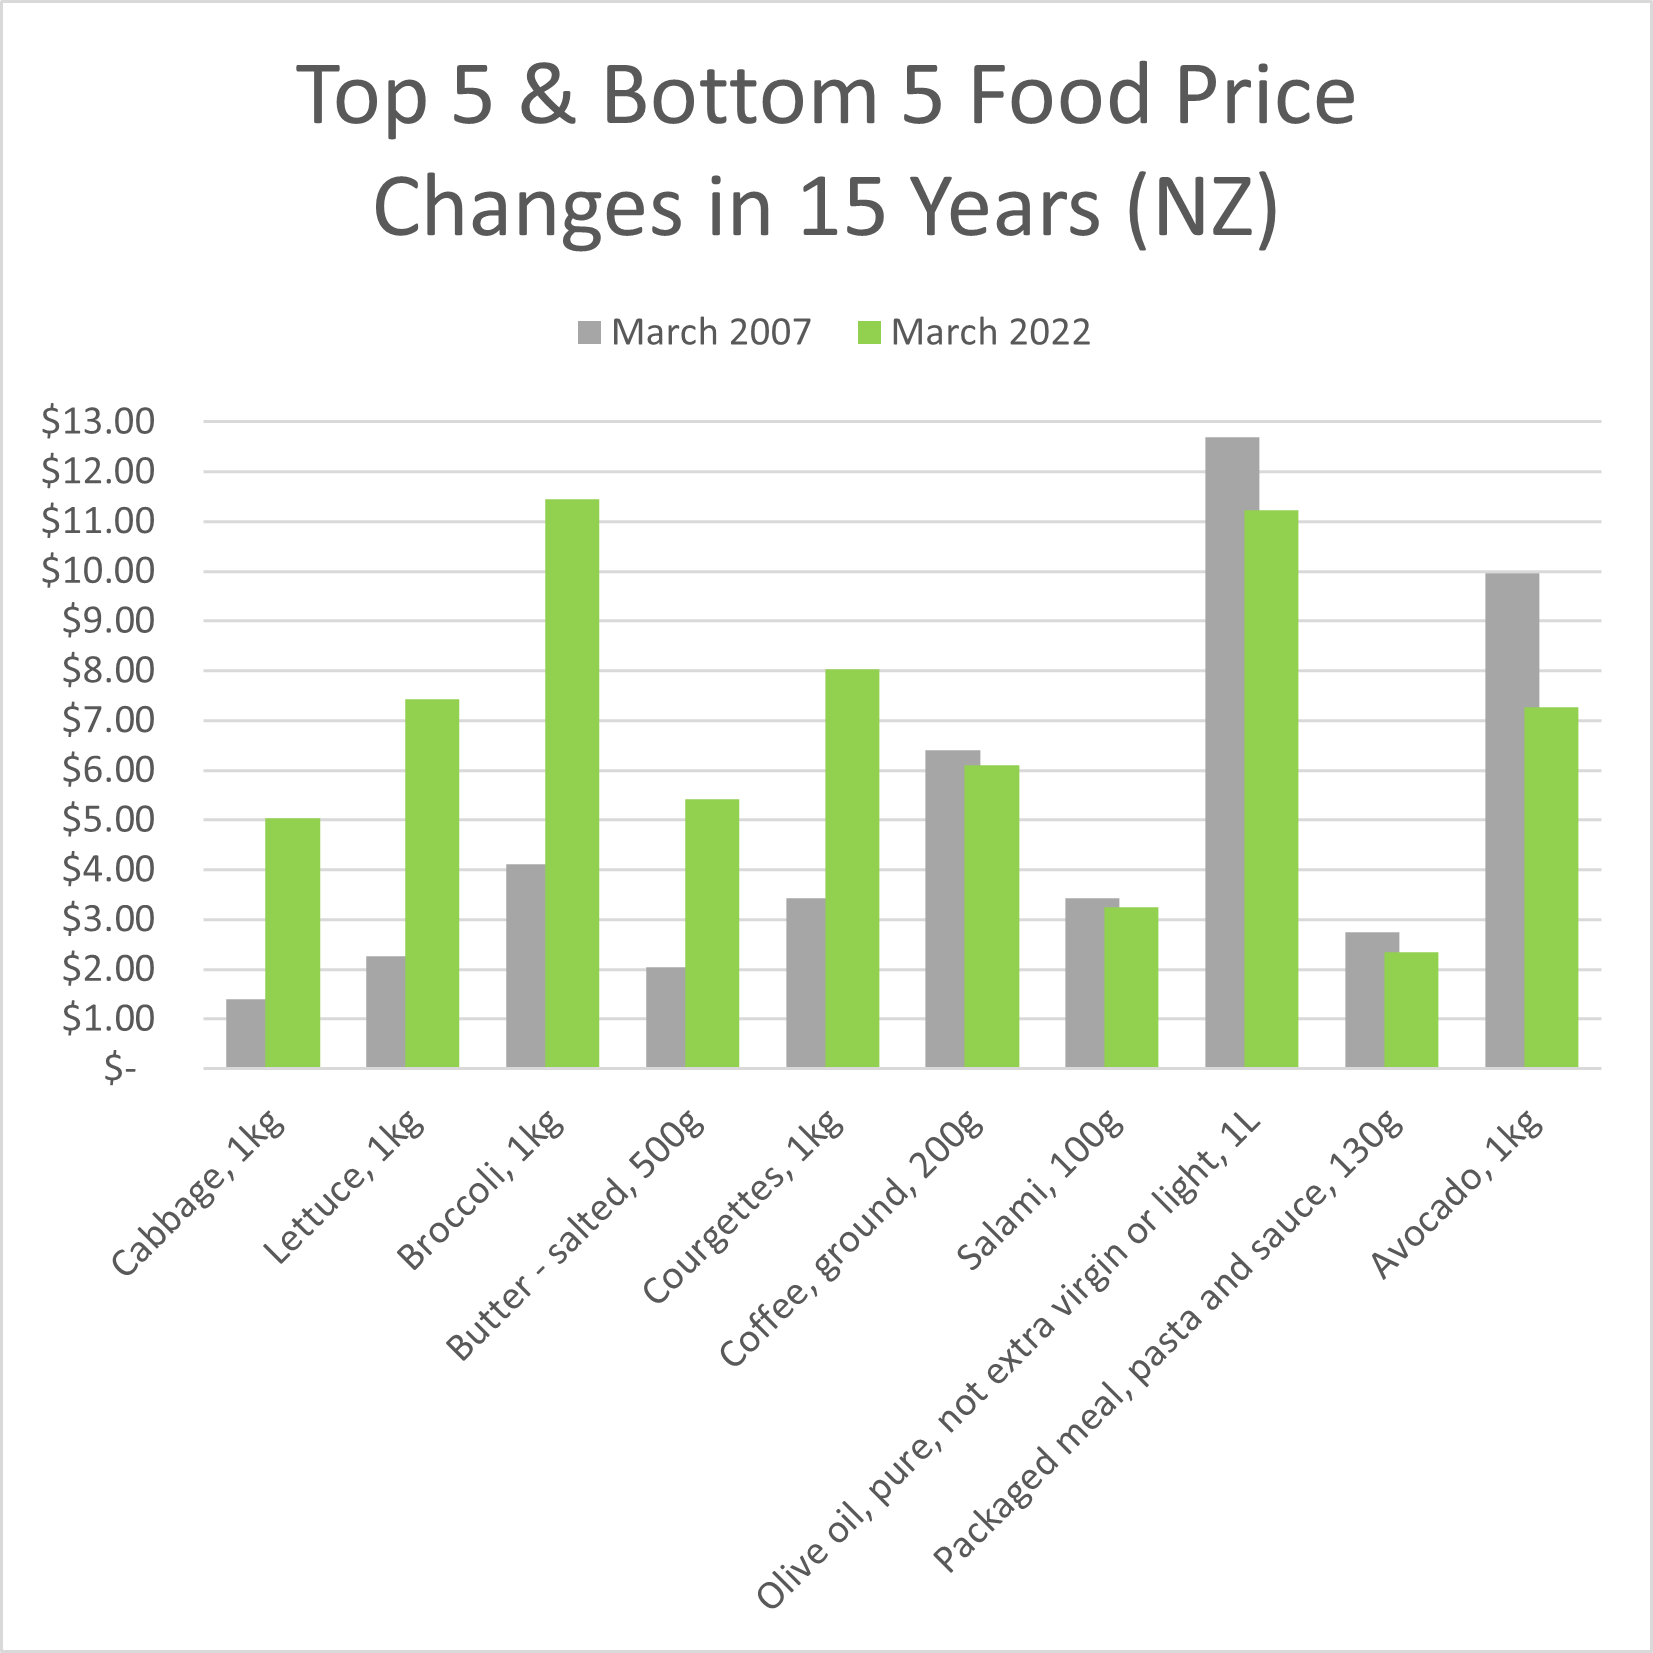
Top 15 and bottom 15 food index price changes over 15 years, in New Zealand.
| Food item | March 2007 price | March 2022 price | % change |
|---|---|---|---|
| Cabbage, 1kg | $1.39 | $5.03 | 262% |
| Lettuce, 1kg | $2.26 | $7.43 | 229% |
| Broccoli, 1kg | $4.11 | $11.45 | 179% |
| Butter – salted, 500g | $2.04 | $5.42 | 166% |
| Courgettes, 1kg | $3.43 | $8.03 | 134% |
| Cream, 300ml – Cheapest Available | $1.33 | $2.89 | 117% |
| Cauliflower, 1kg | $2.60 | $5.38 | 107% |
| Lamb – chops, 1kg | $10.05 | $20.46 | 104% |
| Salmon, imported, pink, canned, unflavoured, 210g | $2.37 | $4.77 | 101% |
| Beef – mince, 1kg | $9.10 | $17.58 | 93% |
| Ice block, water based, each | $1.37 | $2.64 | 93% |
| Corned beef, fresh, chilled or frozen, 1kg | $7.25 | $13.95 | 92% |
| Cheese – mild cheddar (supermarket only), 1kg | $6.46 | $12.24 | 89% |
| Cucumber, 1kg | $4.69 | $8.87 | 89% |
| Sausages, 1kg | $6.15 | $11.63 | 89% |
| Peaches – canned (supermarket only), 410g | $1.58 | $1.73 | 9% |
| Bottled water, 750ml | $1.84 | $1.97 | 7% |
| Pork – loin chops, 1kg | $14.26 | $15.18 | 6% |
| Tomatoes, 1kg | $4.81 | $5.12 | 6% |
| Mayonnaise, 380ml | $3.11 | $3.28 | 5% |
| Biscuits – chocolate, 200g | $2.64 | $2.78 | 5% |
| Muesli, natural or toasted, 750g | $5.01 | $5.23 | 4% |
| Chicken, whole, frozen, No. 15 – Cheapest Available | $7.15 | $7.29 | 2% |
| Chocolate, boxed, loose, 250g | $7.74 | $7.65 | -1% |
| Ham, sliced or shaved, 1kg | $15.47 | $14.97 | -3% |
| Coffee, ground, 200g | $6.40 | $6.11 | -5% |
| Salami, 100g | $3.43 | $3.24 | -6% |
| Olive oil, pure, not extra virgin or light, 1 litre | $12.70 | $11.22 | -12% |
| Packaged meal, pasta and sauce, 130g | $2.74 | $2.34 | -15% |
| Avocado, 1kg | $9.97 | $7.27 | -27% |
…
Which price change surprised you the most?
Do we have a vege crisis?
How do we get healthier foods cheaper?
…
Have your say
…
Notes:
- All available data from March 2007 to March 2022 was analysed.
- We chose 15 years because:
- 5-year intervals are a common time measurement/comparison.
- A number of new items were included in the food index from February 2007.
- It was the longest period of robust data available.
- We chose to show the top 5 and bottom 5 items in the graph because:
- Lists of 5 or 10 are a common comparison technique.
- Any more and it would be hard to read the graph.
- We chose to show the top 15 and bottom 15 items in the table to:
- Provide more insight.
- Mirror the 15 years of data analysed.
- Any more and the the table would be overwhelmingly long.
- We compared March vs March data to remove seasonality differences.
- There are always multiple variables impacting food prices, of course, e.g. weather, disease, trends, and other supply and demand factors.
- Stats NZ footnotes:
- [Prices are] Based on the cheapest available brand or variety in each retail outlet at the time of price collection.
- Calculated by applying index movements to weighted average prices for the June 2006 month. These are not statistically accurate measures of average transaction price levels, but do provide a reliable indicator of percentage changes in prices.
- All numbers are provisional and subject to revision.
Thank you to the Factors who helped pull this together.
…
SOURCES:
Food index from https://infoshare.stats.govt.nz/ (Economic Indicators > Consumers Price Index – CPI > Food Price Index Selected Monthly Weighted Average Prices for New Zealand (Monthly))
This work is based on/includes Stats NZ’s data which are licensed by Stats NZ for reuse under the Creative Commons Attribution 4.0 International licence.
…
Did we make a mistake, or have you got smarter data? Let us know.