KEY DATA NOTES
- There will be some individuals who are both daily smokers and daily vapers. We have asked the Ministry of Health for this breakdown so that we can show it in the graph.
- The New Zealand Health Survey contains a wealth of different health insights, is for all ages 15+, and has a sample size of 6,799.
- The ASH Year 10 Snapshot Survey focuses specifically on smoking and vaping, has an even bigger sample size of 29,260 (44% of all year 10s), is from 2023 (although doesn’t state when), was released 3 days ago on 11 December 2023, but is only a poll of one age group: year 10 (form 4) = 14/15-year-olds.
KEY INSIGHTS
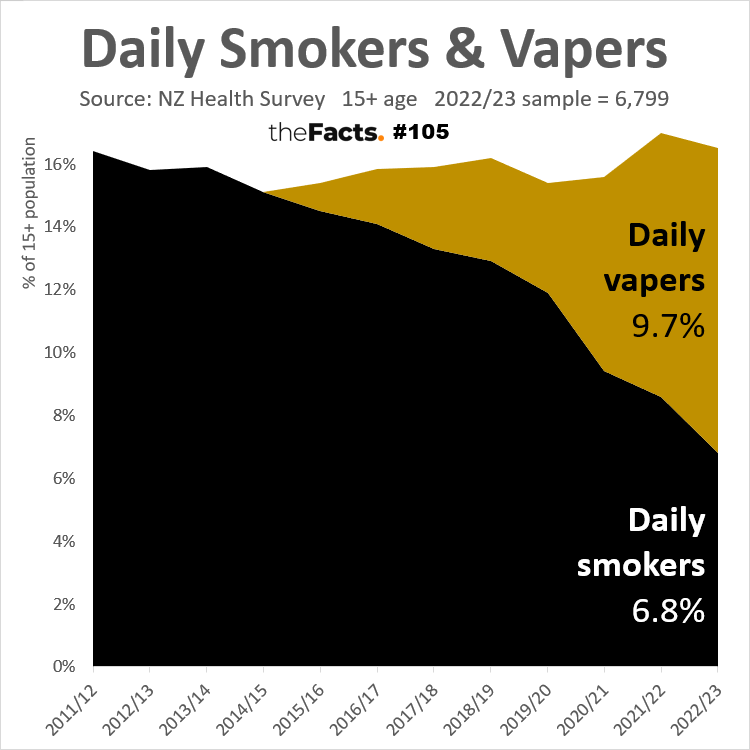
From the New Zealand Health Survey 2022/23:
- The % of daily vapers overtook daily smokers for the first time
- The % of daily vapers + daily smokers has decreased slightly, but the trend is still heading upwards (15.6% -> 17.0% -> 16.5%)
- Daily smoking has rapidly decreased in the last 4 years measured (11.9% -> 9.4% -> 8.6% -> 6.8%)
- Daily vaping has rapidly increased in the last 4 years measured (3.5% -> 6.2% -> 8.4% -> 9.7%)
Other NZ Health Survey key insights from the previous 2021/22 survey:
- “Young people aged 18–24 had the highest rate of daily vaping in 2021/22 (22.9%), up from 5.0% in 2019/20.”
- “A relatively small, but increasing, proportion of daily vapers are people who have never been smokers. In 2021/22, 18% of daily vapers were never-smokers, up from 7% in 2017/18.”
- “Among daily vapers aged 18–24, 33% were ex-smokers, 21% were current smokers (dual users), and 37% were never-smokers (based on pooled data for 2020/21 and 2021/22).”
- NOTE: You can also use the data to analyse other aspects such as heavy smokers, ex-smokers, quit rate, the mean number of cigarettes, manufactured vs roll-your-own, ever tried vaping, daily vs monthly vaping, and various demographic breakdowns
Key ASH Year 10 Snapshot Survey insights not shown in the graph are below and suggest that vaping may be plateauing, or even in decline, amongst this 14/15 year age group:
- “Daily smoking remains low (stable at 1.2%)”, “No changes in… daily smoking”
- “no change in daily vaping (stable at 10.0%)”, “After a large increase in daily vaping between 2019 and 2021, the prevalence of daily vaping appears to have levelled off. Daily use is those who answer that they vape or smoke at least once a day.”
- “Regular vaping [daily + weekly + monthly] significantly decreases for the second consecutive year (18.2% in 2022 to 16.4% in 2023)” [This suggests ‘casual’ vaping is in decline with this age group].
- “Never smoking significantly increases (85.8% to 87.8%) and ever tried vaping significantly decreases (40.1% to 37.5%) for the second consecutive year.”, “Never smoking rates measure the proportion of students who have never smoked a cigarette, even just a few puffs.”, ““Ever tried” vaping is defined as having ever tried an [sic] vape, even just a few puffs.”
- NOTE: graphs and other insights, including ethnicity and gender breakdowns, are available here.
…
KEY QUESTIONS
Why are we so focused on the harms of smoking and not talking as much about the harms of vaping, given:
- The health, household, environmental, social, education, and productivity costs of vaping, especially amongst young people who would have never taken up cigarettes.
- Daily vaping overtaking daily smoking.
- Total smoking + vaping increasing, not decreasing.
…
HAVE YOUR SAY

![]()
…
Full data analysis
Please contact us if you would like the full analysis.
…
Other notes:
- All publicly available data has been published.
- We originally published the 2021/22 data, but then, coincidentally, the 2022/23 data was released just hours later. As such, we’ve updated the graph. Please note that the 2021/22 daily smoker and daily vaper numbers changed due to an error. See https://www.health.govt.nz/nz-health-statistics/surveys/new-zealand-health-survey/corrections-made-2021-22-new-zealand-health-survey-data.
- We were not able to print the ASH graphs due to their data access policies. We will, however, contact them to discuss sharing their work in more detail.
- We use a per capita % to measure the smoking and vaping rates and so that we can compare those trends over time rather than use numerical totals, which are skewed due to New Zealand’s rapid population growth.
- In addition to ‘Daily vapers’ and ‘Daily smokers’, there is a ‘Current vapers’ vs ‘Current smokers’ measure, which correlates strongly, but we couldn’t share this as the ‘Current vapers’ data appears to be missing from the data set. We have asked the Ministry of Health about this.
- ‘Daily vapers’ was first measured in 2015/16 and was 0.9%. It wasn’t measured in 2016/17, but was reintroduced in 2017/18 and measured 2.6%. To complete the graph, we have used an estimate/average value of 1.75% for the 2016/17 year.
- We chose a burnt yellow colour for vaping in the graph as that is often the colour of vaping fluid.
- We chose a black colour for smoking as that is the colour most associated with tar on your lungs.
- Additional details and notes can be found in the data source pages below.
- All numbers are provisional and subject to revision.
Thank you to the Ministry of Health, ASH, and the Factors who helped pull this together.
…
SOURCES:
- New Zealand Health Survey = https://www.health.govt.nz/nz-health-statistics/surveys/new-zealand-health-survey
Data published by The Ministry of Health
(c) Crown Copyright
Licensed for use under the creative commons attribution licence (BY) 4.0
- ASH Year 10 Snapshot Survey = https://www.ash.org.nz/ash_year_10
Data sets and graphs have not been used or reproduced. We have only quoted words from their public press releases. However, we have contacted them to discuss sharing their data and graphs further.
…
Did we make a mistake, or have you got smarter data? Let us know.