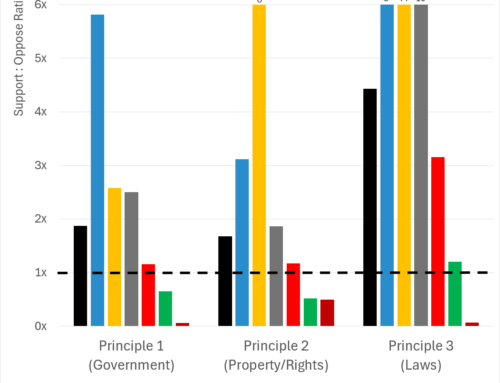
KEY INSIGHTS
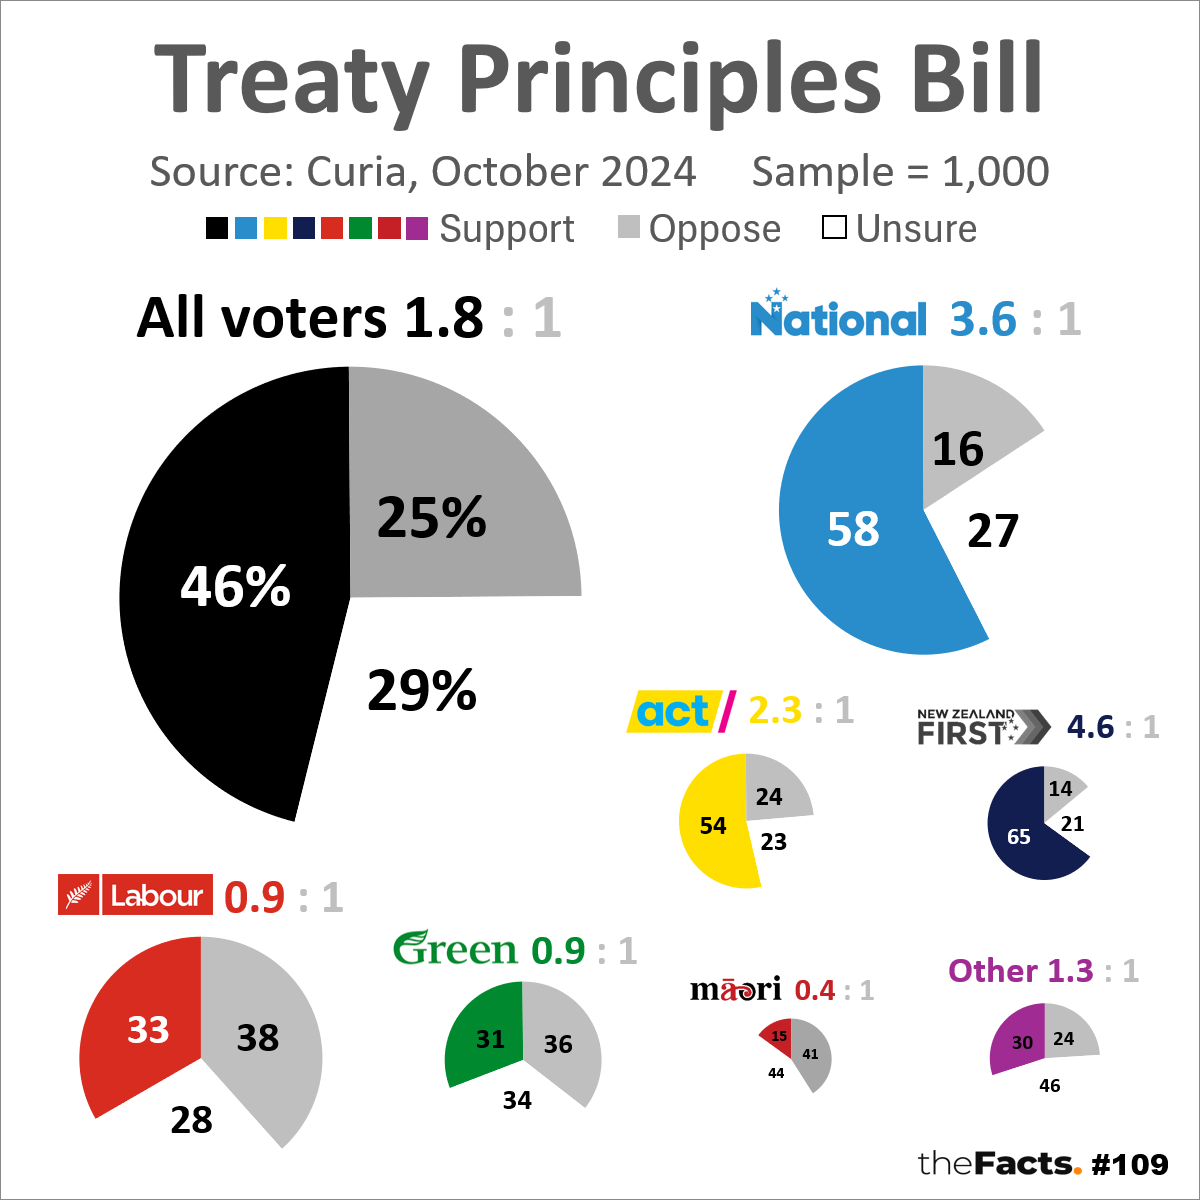
Based on this research by Curia, when it comes to the latest wording in the proposed Treaty Principles Bill, the support-to-oppose ratios (which are the most important measure in general elections and also should a yes/no referendum occur), are:
- New Zealand voters = 1.8 : 1
46% support/25% oppose, 29% unsure
(was 3.3:1, 60%/18%, 22% in October, 2023, so a 14 percentage point drop in support with half (7) going to oppose and half (7) going to unsure)
20 percentage point drops or more in support have been highlighted in green below. 10 percentage point increases in opposition in red. 10 percentage point increases in unsure in orange.
- National voters 3.6 : 1
58%/16%, 27% unsure
(was 4.4, 66%/15%, 19%)
- ACT voters 2.3 : 1
54%/24%, 23% unsure
(was 6.4, 77%/12%, 11%)
- NZ First voters 4.6 : 1
65%/14%, 21% unsure
(sample size was too small to report last poll)
- Labour voters 0.9 : 1
33%/38%, 28% unsure
(was 6.2, 62%/10%, 28%)
- Green voters = 0.9 : 1
31%/36%, 34% unsure
(was 1.0, 34%/33%, 33%)
- Te Pāti Māori voters = 0.4 : 1
15%/41%, 44% unsure
(sample size was too small to report last poll)
- Other voters = 1.3 : 1
30%/24%, 46% unsure
(was 15.5, 62%, 4%, 34%) support it
FULL DEMOGRAPHIC INSIGHTS
The figures shown below represent the support:oppose ratio, support %/oppose %, unsure %.
- Gender:
- Males = 2.1, 50%/24%, 26% (was 3.6, 62%/17%, 20%)
- Females = 1.6, 42%/26%, 31% (was 3.2, 58%/18%, 24%)
- Age:
- 18-39 = 1.8, 43%/24%, 33% (was 3.9, 59%/15%, 26%)
- 40-59 = 2.1, 52%/25%, 23% (was 2.4, 55%/23%, 23%)
- 60+ = 1.6, 43%/27%, 30% (was 4.5, 67%/15%, 18%)
- Location:
- Auckland = 2.6, 49%/19%, 32% (was 2.4, 56%/23%, 21%)
- Wellington = 1.2, 43%/35%, 23% (was 2.8, 59%/21%, 20%)
- Christchurch = 2.6, 59%/23%, 18% (was 7.5, 60%/8%, 32%)
- Provincial Cities = 1.2, 40%/33%, 28% (was 4.4, 62%/14%, 23%)
- Towns = 1.6, 46%/28%, 25% (was 3.3, 59%/18%, 24%)
- Rural = 2.4, 44%/18%, 38% (was 4.5, 67%/15%, 18%)
12 KEY QUESTIONS
- Why has the support-to-oppose ratio overall dropped from 3.3 to 1.8? Is this due to the change in wording? How parties have communicated to their supporters? Media coverage? Council influence, including the push for Māori wards? Union or academic influence? Issue fatigue? Social/racial division fatigue? Polling variables? Something else?
- Given most Kiwis still support the Bill by a ratio of almost 2:1, why is this not reflected in mainstream media coverage? Why are these polls, the only ones publicly available to our knowledge, not covered?
- Why has the National Party been so strong in its commitment to support the Bill only to the first reading when almost 4:1 of their voters want it?
- Why has NZ First been so strong in its commitment to support the Bill only to the first reading when almost 5:1 of their voters want it?
- Why have ACT voter views changed so significantly? The support-to-oppose ratio has dropped from 6.4 to 2.3, with support dropping from 77% to 54%, opposition rising from 12% to 23%, and the unsure rising from 11% to 23%.
- Does the ACT Party have superior voter research skills/suppliers compared to the other parties who seem to have misread the nation on this issue?
- Why have Labour voter views changed so significantly? The support-to-oppose ratio has dropped from 6.2 to 0.9, with support dropping from 62% to 33%, opposition rising from 10% to 38%, and the unsure staying at 28%.
- Why are the Labour and Green parties opposed to the Bill when their voters are split fairly evenly between support and opposition?
- Why are only 41% of Te Pāti Māori voters opposed, and why are 44% still unsure?
- Why have Other party voter views changed so significantly? Is this influenced by how the likes of TOP have communicated to their supporters? The support-to-oppose ratio has dropped from 15.5 to 1.3, with support dropping from 62% to 30%, opposition rising from 4% to 24%, and the unsure rising from 34% to 46%.
- Why has support decreased so much for the 60+ age group? The support-to-oppose ratio has dropped from 4.5 to 1.6, with support dropping from 67% to 43%, opposition rising from 15% to 27%, and the unsure rising from 18% to 30%.
- In general, how do we resolve disagreements around the Treaty/Te Tiriti to achieve greater social unity in New Zealand going forward?
…
HAVE YOUR SAY
![]()
…
FULL DATA ANALYSIS
Please contact us if you would like the full data set and research.
…
ADDITIONAL NOTES:
- The research was conducted by Curia Market Research.
- Polling dates = October 3-7, 2024
- Sample size = 1,000 (800 by phone and 200 by online panel)
- Weighted for = gender, age, area
- Sample error = +/-3.1% at the 95% confidence level. Results for sub-groups such as age and area will have a much higher margin of error and not seen as precise.
- Question asked:
Parliament will soon consider a bill that would define the principles of the Treaty of Waitangi as the following.
Civil Government: The Government of New Zealand has full power to govern, and Parliament has full power to make laws. They do so in the best interests of everyone, and in accordance with the rule of law and the maintenance of a free and democratic society.
Rights of Hapū and Iwi Māori: The Crown recognises the rights that hapū and iwi had when they signed the Treaty. The Crown will respect and protect those rights. Those rights differ from the rights everyone has a reasonable expectation to enjoy only when they are specified in legislation, Treaty settlements, or other agreement with the Crown.
Right to Equality: Everyone is equal before the law and is entitled to the equal protection and equal benefit of the law without discrimination. Everyone is entitled to the equal enjoyment of the same fundamental human rights without discrimination.
Do you support or oppose those principles being defined in legislation as the principles of the Treaty of Waitangi?
- Additional methodology variables are privately listed for paying clients at this stage, but we will post them here if/when they become publically available.
- We chose to focus the graphic on the support and opposition for the Treaty Principles Bill by party, rather than gender, age or location, since the Bill’s legislative fate will first be decided by political party votes in Parliament.
- For the graph colours, we chose to highlight the level of support in the bolder colour since support made up ~2/3 of responses.
- We chose black for all New Zealand voters since it’s our national colour.
- The political party colours from their brand logos and colour palettes.
- Other voters in purple being a different colour, and a mix of blue and red combined.
- We adjusted the area sizes of the political party pie graphs to represent their share of the vote at the 2023 election. See https://archive.electionresults.govt.nz/electionresults_2023/.
- We have led with the support:oppose ratio since:
- If this does go to a Government referendum or citizens’ initiated referendum, then only binary yes/no or support/oppose options will likely be given. There will be no unsure option.
- If this does not go to referendum, it will still have an influence on party polling and voting at the next election, which is most influenced by those feeling strongly one way or another on issues, rather than those that feel indifferent or unsure in the middle.
NOTE: some analysts will lead with a net support figure. We don’t believe this is best for the reasons above. It also downplays the level of support, and is hard for the layman observer to interpret these numbers, e.g. net support of 5% could be 50-45% or 30-25%.
- We rounded the support:oppose ratios in the graphic to 1 decimal point to balance accuracy with comprehension, design, and engagement levels.
- All numbers are provisional and subject to revision.
Thank you to the Factors who helped pull this together.
…
SOURCE:
Research Report = private Curia research for clients. See https://www.patreon.com/posts/exclusive-poll-113652116?utm_campaign=patron_engagement&utm_source=post_link&post_id=113652116&token=eyJhbGciOiJIUzI1NiIsInR5cCI6IkpXVCJ9.eyJyZWRpc19rZXkiOiJpYTI6OWI2ZTFkMjMtYzMzMi00NjJjLWEzYTYtYzNjYzkyNTUxNGVhIiwicG9zdF9pZCI6MTEzNjUyMTE2LCJwYXRyb25faWQiOjkyMTgzNzk5fQ.BBygyCd4rYji91aPgGk-rlTxhOZPnNGDu9srw0vssdM&utm_id=fb4f6f26-06e4-467b-aea6-5e990d96a5c2&utm_medium=email
Republished with permission
2023 election results = https://archive.electionresults.govt.nz/electionresults_2023/
…
Did we make a mistake, or have you got smarter data? Let us know.