KEY INSIGHTS
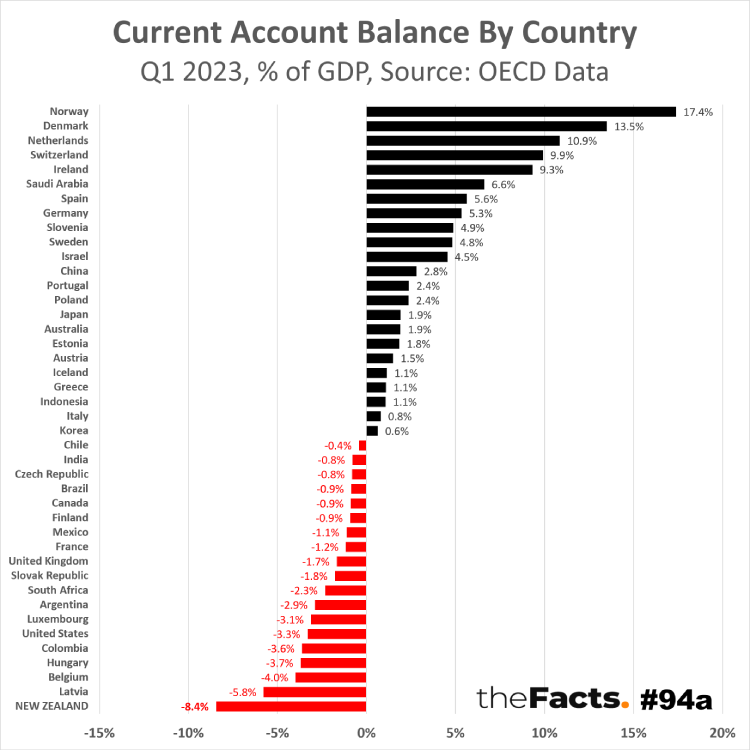
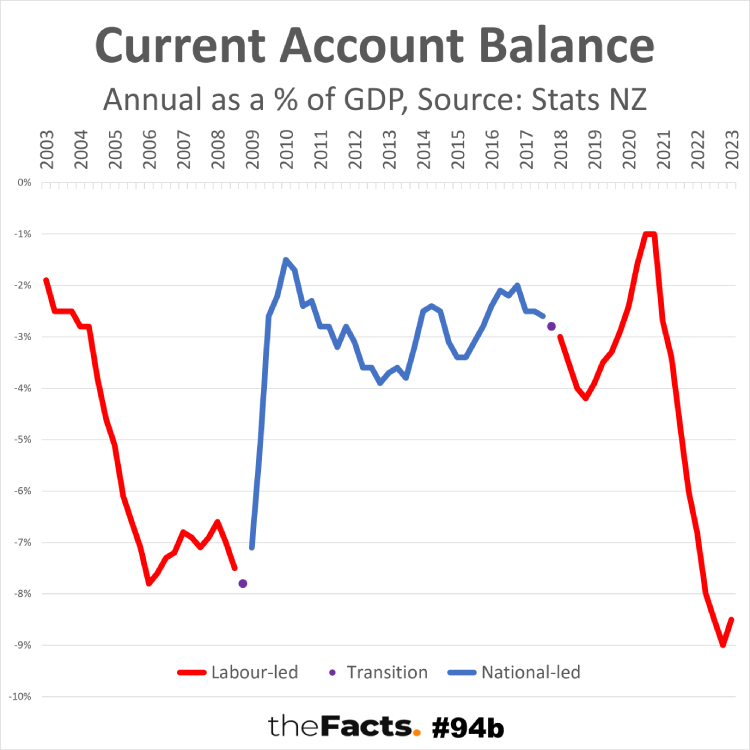
New Zealand’s current account balance as a % of GDP is now:
- The Worst in the OECD
- Worse than it was during the GFC
- Negative for every year shown above
KEY QUESTIONS
- Is this a problem? If not, why not? If so, how bad is it?
- Can we determine from this data that National-led Governments outperform Labour-led Governments on current account management?
- How do we improve it? Can we get into positive figures?
…
HAVE YOUR SAY


…
FULL DATA ANALYSIS
Please contact us if you would like the full data set and research.
…
NOTES:
- The OECD data is showing Q1 2023 data comparisons at the time of publishing, which is why we used that.
- Stats NZ data is for Q1 2003 to Q2 2023. We will seek a longer time series through their other data archives.
- There are many variables that impact the current account balance, of course, e.g. the GFC, Covid, consumption trends, foreign exchange rates, import/export tariffs, free-trade agreements, weather impact on exports/imports.
- We consider quarters that contain elections and Government formation negotiations to be neutral and have shown these separately.
- For the OECD graph, we chose black for positive numbers (being in the black) and red for negative numbers (being in the red).
- For the NZ graph, we chose red for Labour-led governments, blue for National-led governments, and purple (a mix of red and blue) for quarters where there was a transition between governments.
- All numbers are provisional and subject to revision.
Thank you to the Factors who helped pull this together.
…
SOURCES:
- Current account balances by OECD country = https://data.oecd.org/trade/current-account-balance.htm#:~:text=Related%20topics&text=The%20current%20account%20balance%20of,resident%20and%20non%2Dresident%20entities.
Licensed for reuse under the Creative Commons Attribution 4.0 International licence.
- Current account balances for NZ over time = https://www.stats.govt.nz/news/annual-current-account-deficit-33-0-billion/#:~:text=The%20annual%20current%20account%20deficit,year%20ended%2031%20December%202022.
This work is based on/includes Stats NZ’s data which are licensed by Stats NZ for reuse under the Creative Commons Attribution 4.0 International licence.
…
Did we make a mistake, or have you got smarter data? Let us know.