KEY INSIGHTS
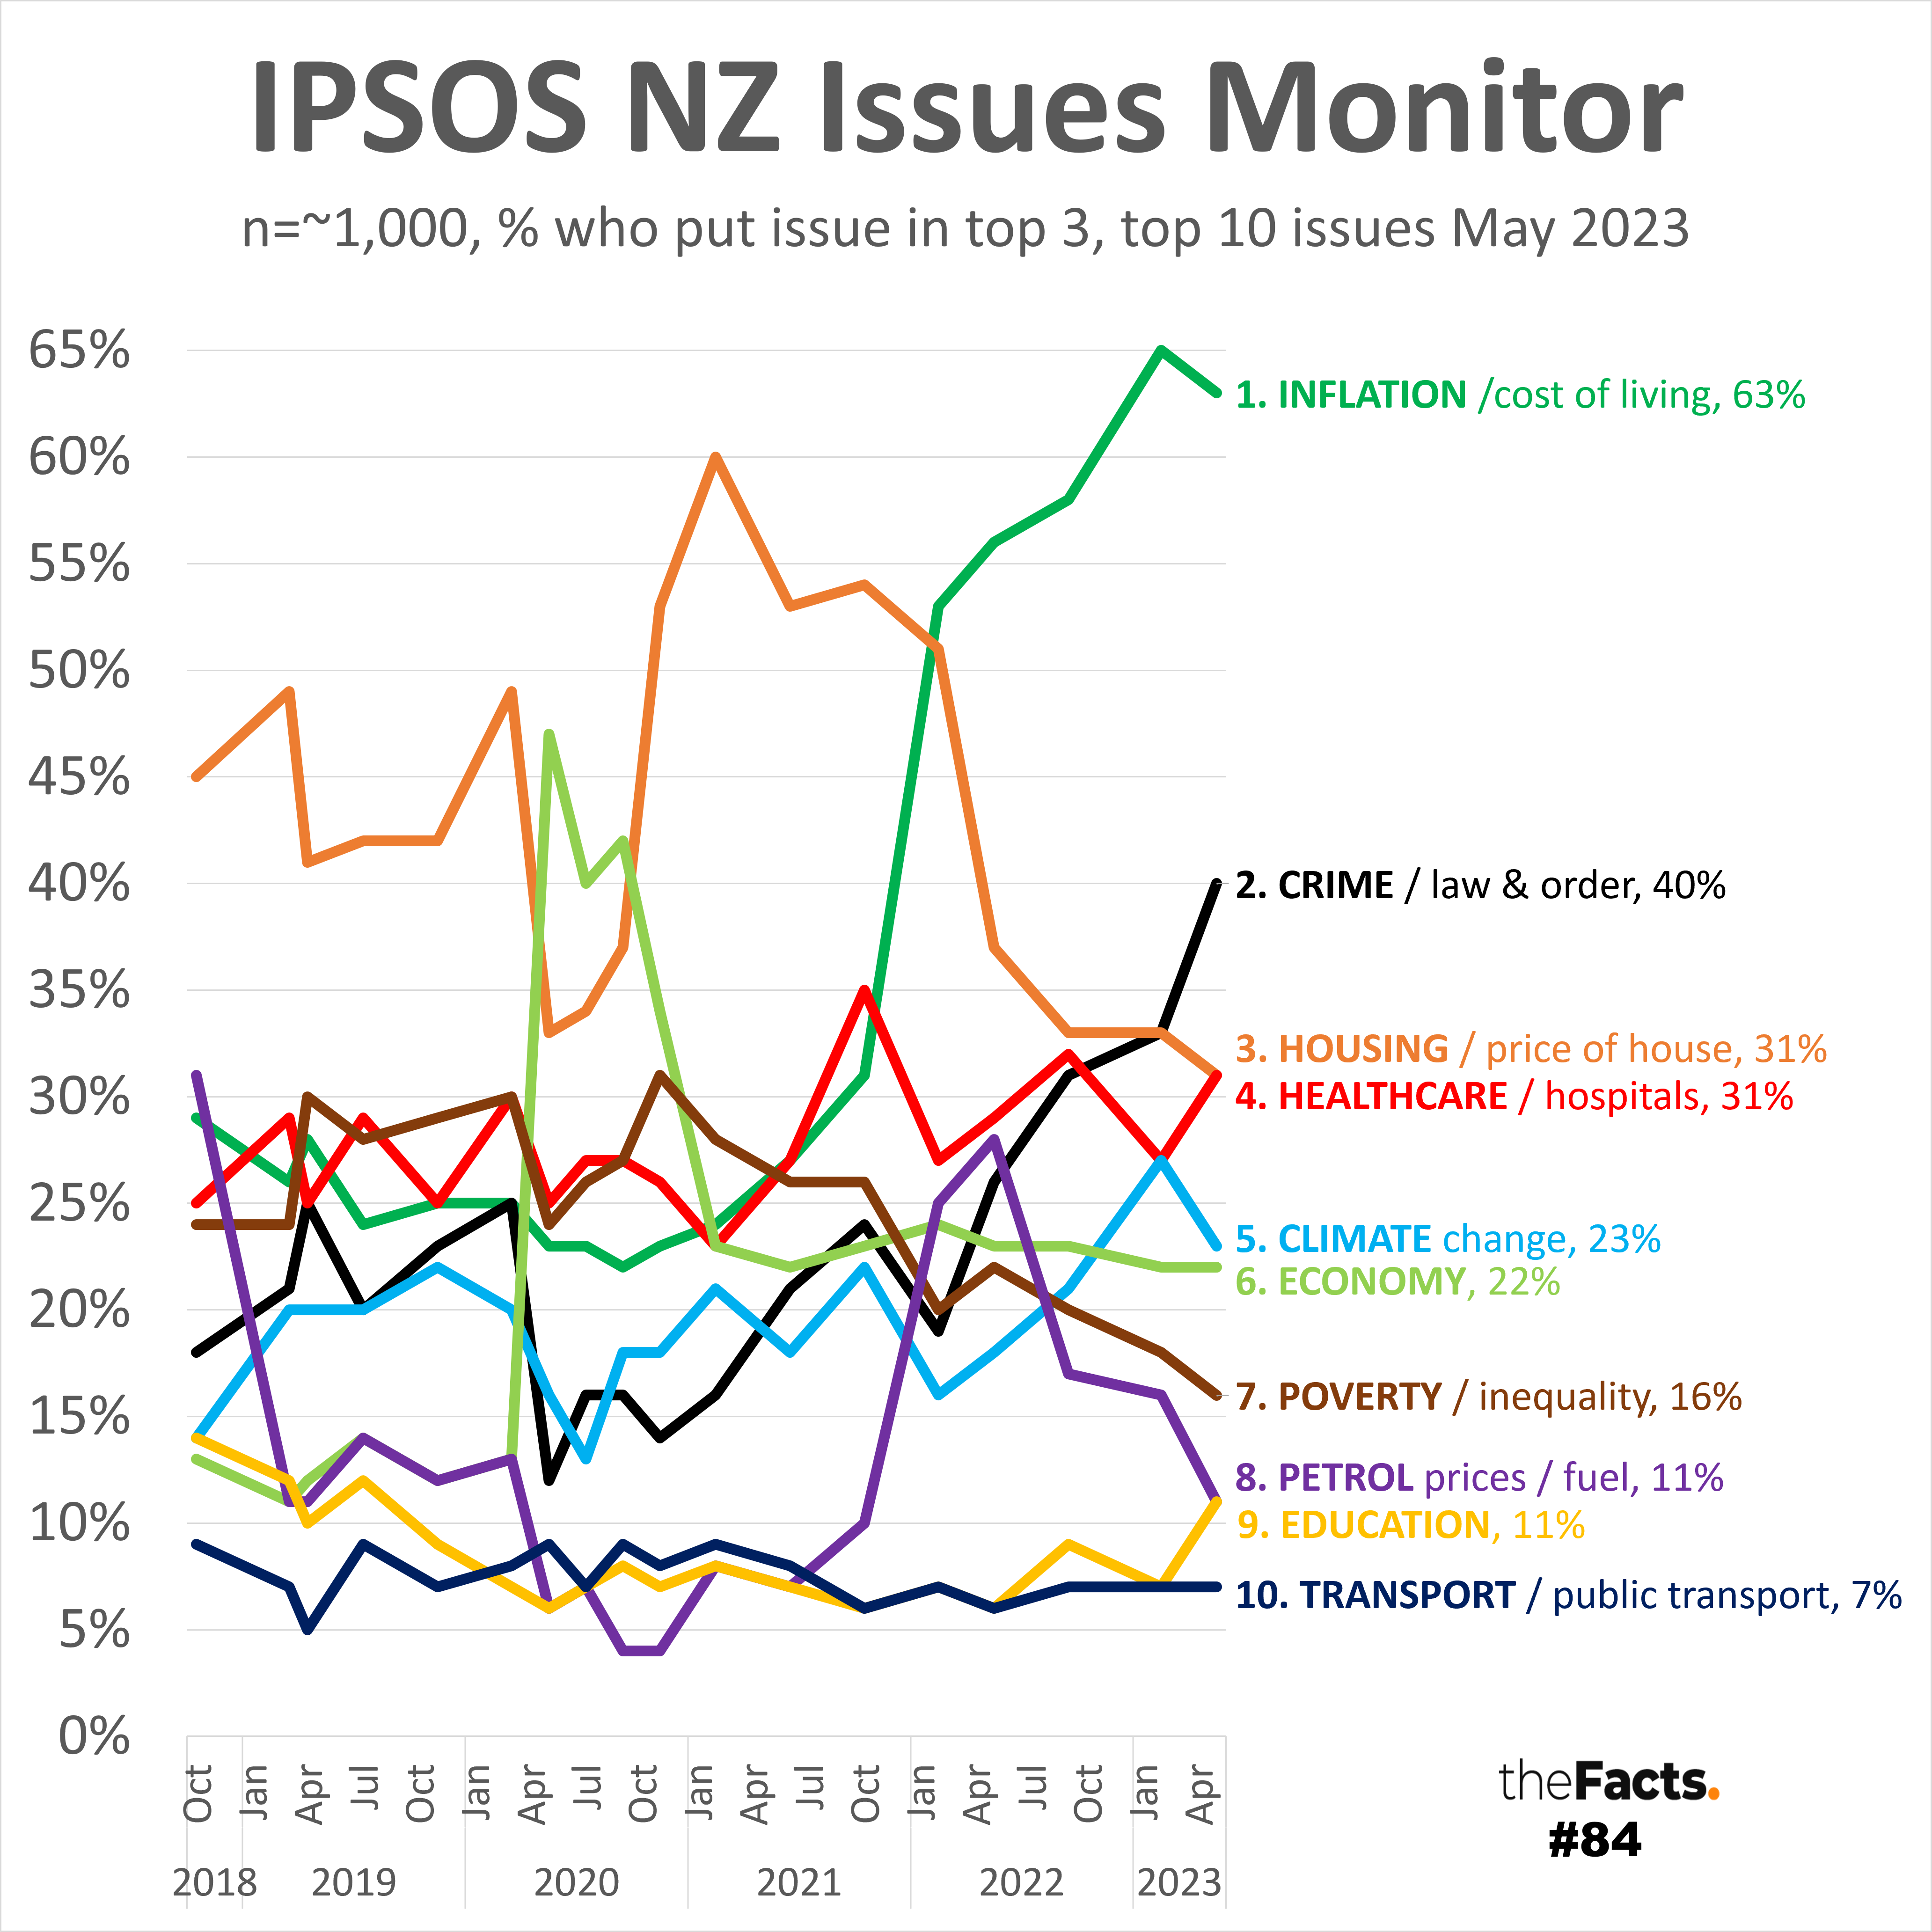
- Inflation / cost of living is still easily the #1 issue in the IPSOS NZ Issues Monitor research (and also the #1 issue in both Curia and Kantar research that we’ve looked into in the past too). 63% of those polled put it as a top three issue.
- Crime has rapidly risen to become the #2 issue in New Zealand, and a record high for this measure, with 40% of those polled putting it in their top three issues.
- Housing and Healthcare are even on 31% for the #3 and #4 issues.
- Climate change is just above Economy for the #5th issue with 23% and 22% respectively, however, one could argue that Inflation and Housing affordability/supply are economic issues so the Economy overall might be the #1 issue.
- Poverty has been consistently declining in these rankings. Remember, though, these are comparative concern rankings, not absolute concern levels.
- Petrol concerns have rapidly declined relative to other issues too
- Education concerns have rapidly risen
- After this, other issues include:
- Household / personal debt = 7%
- Taxation = 7%
- Drug / alcohol abuse = 7%
- Environmental pollution / water concerns = 5%
- Unemployment = 5%
- Race relations / racism = 4%
- Issues facing Māori = 2%
- Population / overpopulation = 2%
- Immigration = 2%
- Defence / foreign affairs / terrorism = 1%
KEY NOTES
- No pollster lists Government performance overall as an issue option. Many, however, track a separate Country Direction or Government Confidence metric.
- Curia is the only one listing Social Unity/Division as an issue. This result for May is hidden behind a paywall.
- Kantar research is the only one to ask about Protection of NZ children and it was the #2 issue in their last research. They appear to be the only ones asking about Mental Wellbing of NZers and Suicide rates too, so it is hard to gauge where those issues stand.
…
KEY QUESTIONS
- Do you agree with the order and importance of these issues?
- Which issue surprised you the most?
- How do we fix them?
…
HAVE YOUR SAY
![]()
![]()
…
Polling companies
- We have found three different polling companies that research and publish issue rankings for New Zealand:
- IPSOS
- Asks respondents for their top 3 issues from the list of 20 shown above.
- SOURCE: https://www.ipsos.com/en-nz/20th-ipsos-new-zealand-issues-monitor
- Curia
- Asks respondents for their top 1 issue from a list, but only publicly shares a selection of the top issues.
- SOURCE: https://www.taxpayers.org.nz/taxpayers_union_curia_poll_may_2022
- Kantar
- Show respondents 20 ‘concerns’ at random from a list of 48 concerns in total. They publicly share the top 10. We are not sure how they generate their % scores, or what the other 38 issues are, but have asked previously.
- SOURCE: https://www.kantarnewzealand.com/better-futures-2023/
- IPSOS
- If you know of other polling companies that publish issue information like this, please let us know.
…
Polling comparison
- Remember that each polling company asks the question in a very different way.
- Major differences between the polling companies include:
- IPSOS tests 20 issues. Kantar tests 48. We do not known how many Curia tests.
- IPSOS splits out Inflation /cost of living with Petrol prices / fuel
- Curia tests Policies and Covid-19, but IPSOS does not.
- Kantar tests Protection of NZ Children, Suicide rates and Mental Wellbeing of NZers but IPSOS does not. We don’t know if Curia does as we don’t have their full list.
- Kantar splits out Violence in society and Crime levels, and also splits up Environment in multiple sub-issues
- We can’t understand further differences unless/until we have the full issue lists from Curia and Kantar.
- See https://thefacts.nz/social/inflation-cost-of-living-is-the-1-issue-for-kiwis/ for more detail, including an adjusted comparison score table.
…
Full data analysis
Please contact us if you would like the full data set and research.
…
Notes
- All publicly available data has been included.
- Decimal places are not publicly provided by any of the three polling companies.
- We had to visually guess the scores for two data points in the IPSOS data, but are confident we got them correct. If we didn’t, they will only be out by 1 percentage point, and for 2019.
- IPSOS data:
- The results are relative, not absolute, so can show an issue’s % decreasing over time even though society is growing more concerned with it and, similarly, can show an issues % increasing over time even though society is growing less concerned with it.
- We included the top 10 issues only because:
- Top 10 lists are common
- To illustrate the drop down from Petrol and Education on 11%, to Transport on 7%
- NOTE: Household / personal debt, Taxation, and Drug / alcohol abuse were all also on 7% once rounded.
- We selected the colour coding based on what we felt was a fair symbolic representation of each issue/area.
-
- We numbered the top 8 issues in the graphic because:
-
- These represent 78% of all issues put into the top three by respondents.
- There was a significant drop off from Petrol prices / fuel at 17% and Environmental pollution / water concerns at 11%
- The colour-coding was automatically assigned by Excel.
- We changed the font size to mirror the % scores, except for issues 9-20 so that they remained readable.
-
- All numbers are provisional and subject to revision.
Thank you to the Factors who helped pull this together.
…
Source
IPSOS information presented in a graphic with permission.
Licensed for use under the creative commons attribution licence (BY) 4.0
…
Did we make a mistake, or have you got smarter data? Let us know.