
KEY NOTES
- In the 2022 Budget, a new way to measure net debt was introduced called “Net Debt.” It subtracts the value of the NZ Super Fund. For more information, click here.
- Since the 2023 June Financial Year is almost complete, the 2023 Forecast figures are based mostly on actual data. We have left it labeled as “Forecast” rather than breaking out the actual vs forecast numbers.
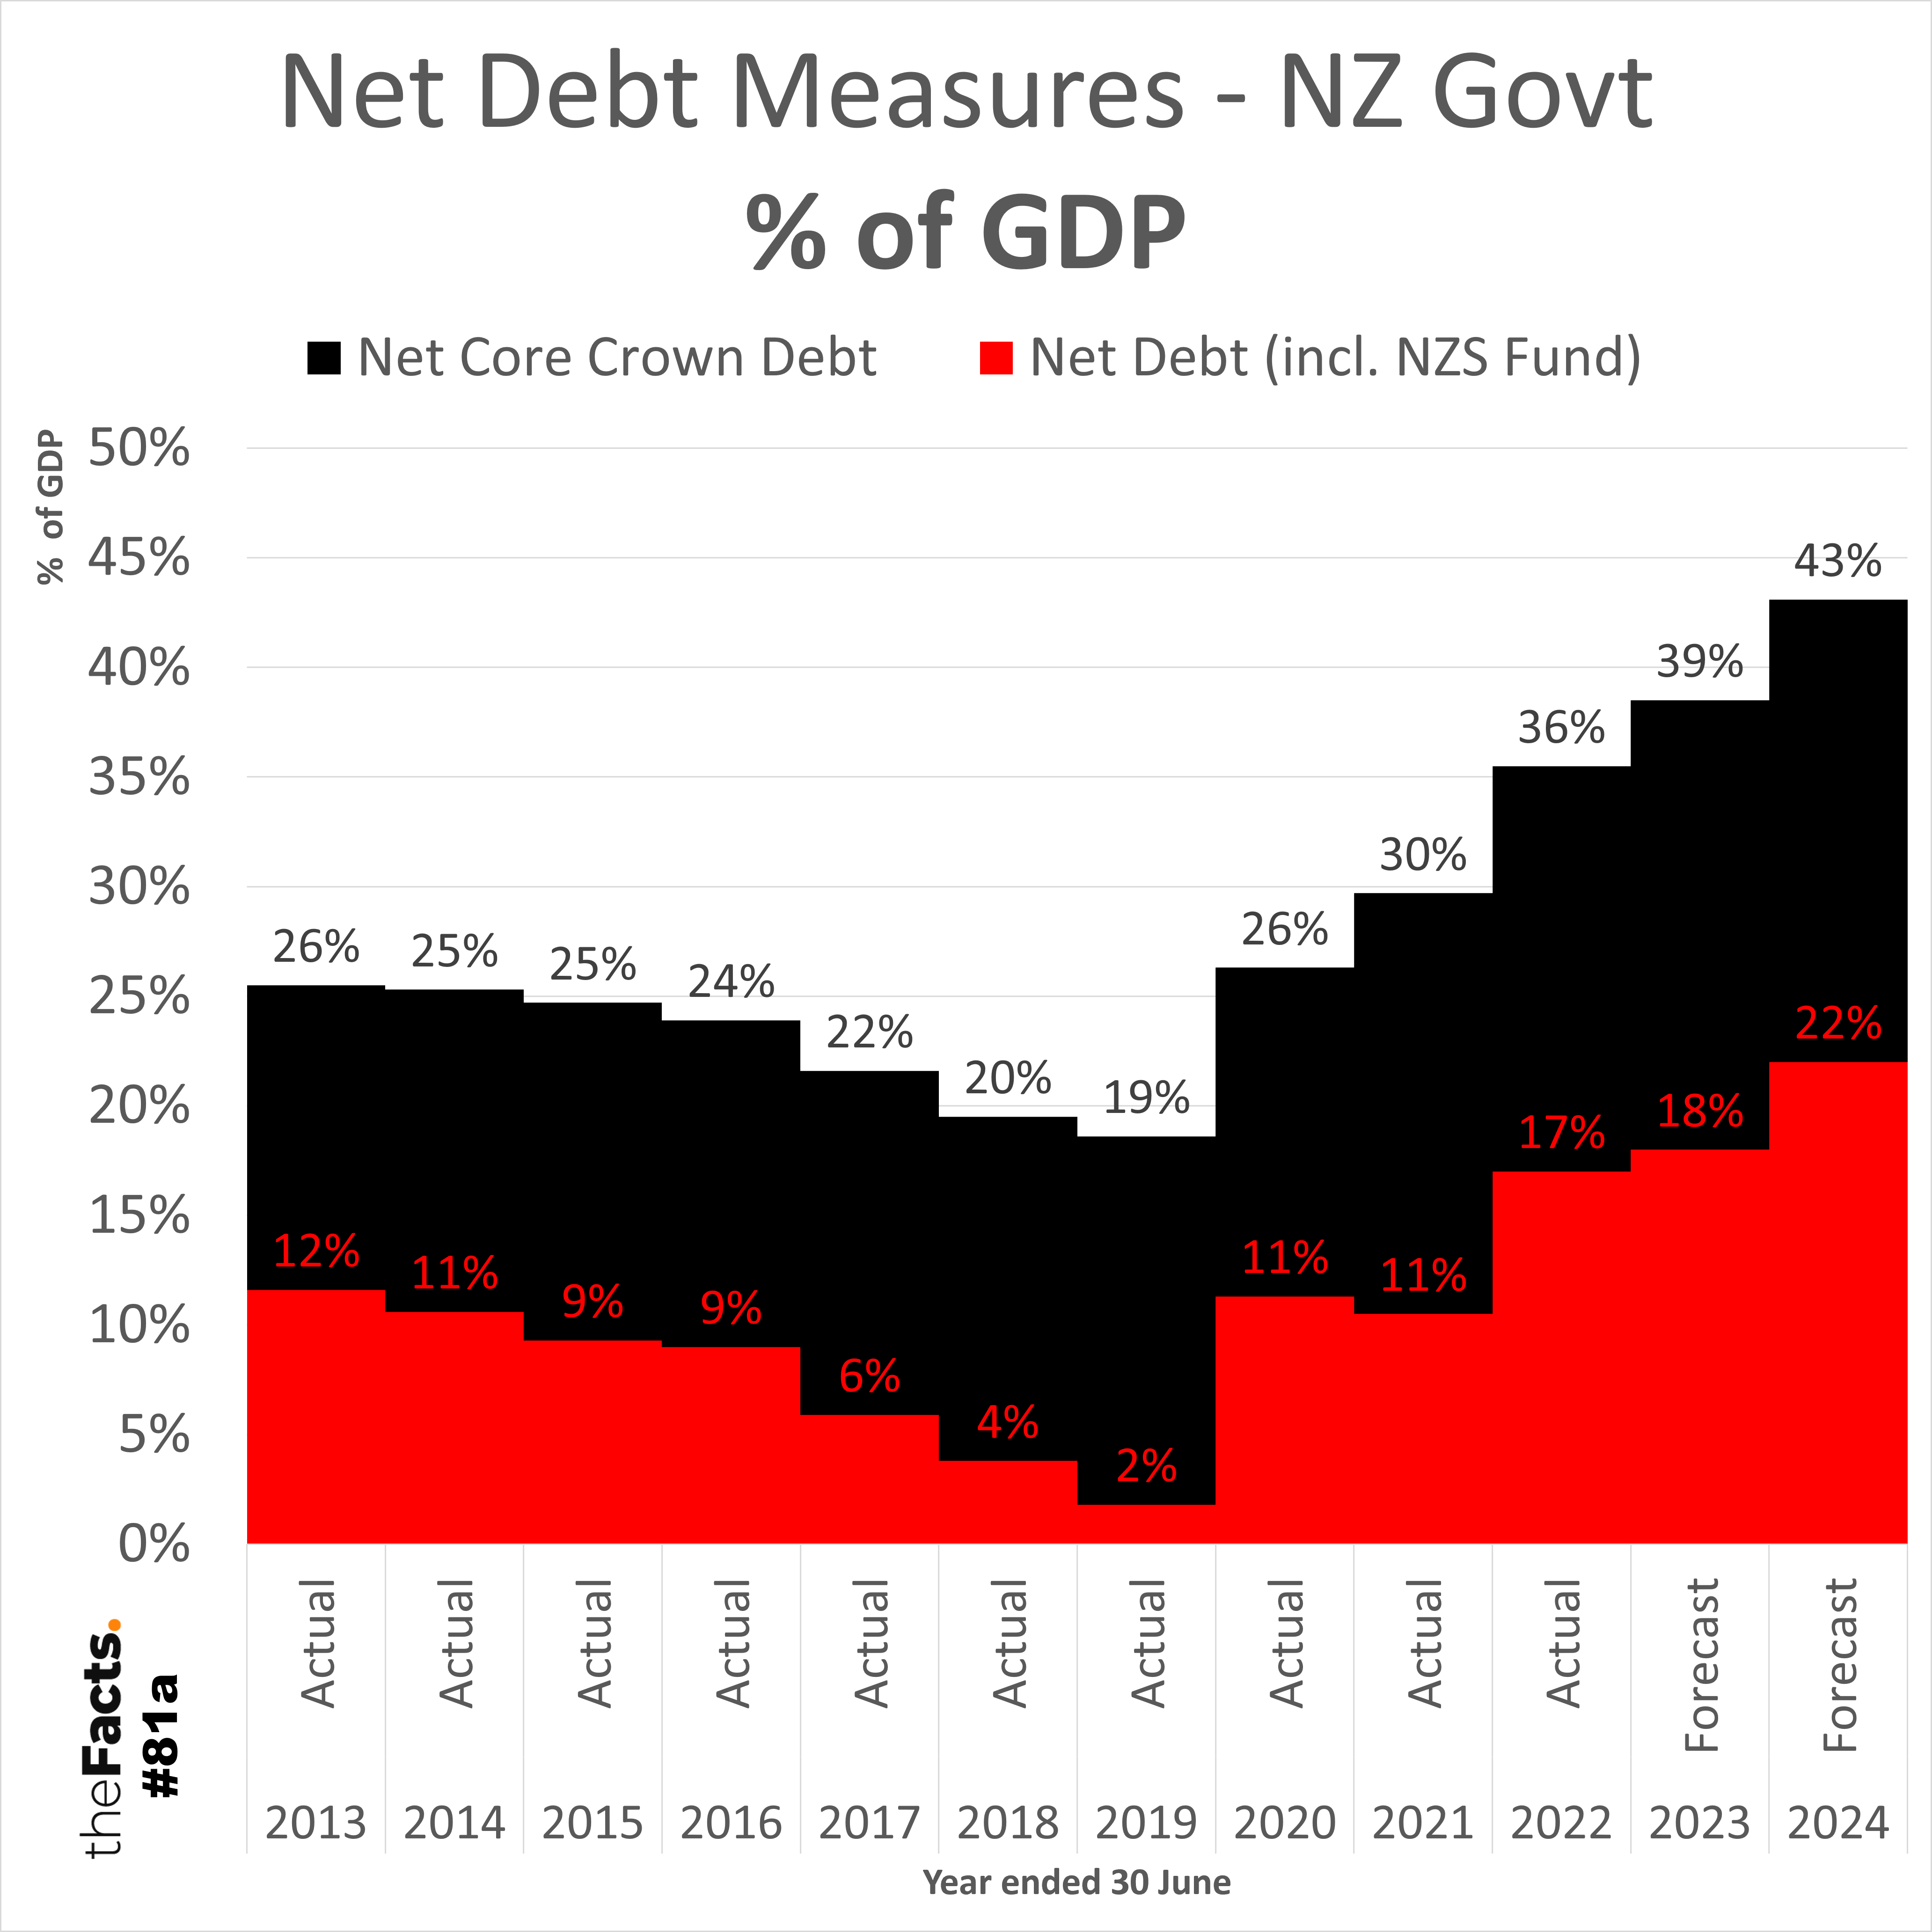
- % of GDP is generally considered the better way to measure government debt as it accounts for inflation and population changes.
KEY INSIGHTS
As a % of GDP:
- Net Core Crown Debt has more than doubled from 18.6% in 2019 to 38.5% in 2023 (forecast)
- Net Debt has increased 10x from 1.8% in 2019 to 18.0% in 2023 (forecast)
In Billions NZD:
- Net Core Crown Debt has increased 2.6x from $58 billion in 2019 to $152 billion in 2023 (forecast), and is set to more than triple to $179 billion in 2024 (forecast)
- Net Debt has increased 13x from $5 billion in 2019 to $71 billion in 2023 (forecast), and is set to increase by more than 16x to $91 billion in 2024 (forecast)
KEY QUESTION
Are you happy with this level of Government debt?
…
Have your say
![]()
![]()
…
Full data analysis
Please contact us if you would like the complete data set and research.
…
Other notes:
- We have led with the % of GDP graph since % of GDP is generally considered the better way to measure government debt as it accounts for inflation, population, and economy changes.
- We’ve shown both % and $ values in dual graphs to help New Zealanders better understand Crown/Government debt relative to GDP. Combining these into one graph, as we have done before, hindered comprehension for some audiences so we felt it was best to split them apart.
- Actual data from before 2013 was not included in this data set but can be accessed through previous Budget and Economic Fiscal Updates (BEFU). We have asked Treasury if a single time-series data set exists.
- Since the 2023 June Financial Year is almost complete, the 2023 Forecast figures are based mostly on actual data. We have left it labeled as “Forecast” rather than breaking out the actual vs forecast numbers.
- We have chosen to show out to the 2024 Forecast figures for two reasons:
- Previous forecasts have proven to be very inaccurate.
- There is a general election on October 14 which could change Crown revenue, spending, and debt levels significantly.
- Net Core Crown Debt has historically been the most commonly used economic indicator for Government debt.
- We have also included the new debt metric introduced in the 2022 budget that includes the NZSF (New Zealand Super Fund) and other amounts. Please note that there is still some controversy surrounding this change, and this metric might not be available for all previous years for comparison like the Net Core Crown Debt figure. The Government’s explanation on the dual net debt metrics from https://budget.govt.nz/budget/2023/wellbeing/fiscal-strategy/debt-measure.htm#:~:text=The%20Treasury’s%20Budget%20Update%20shows,than%20forecast%20at%20Budget%202021 is:
-
“At Budget 2022 we adopted a new net debt measure to better measure New Zealand’s fiscal sustainability”
-
“The new net debt measure is more closely aligned with net debt measures used internationally, and better captures borrowing under the control of the Government and assets that provide offsets to that borrowing. We also recalibrated our debt ceiling to align with the new net debt measure. To support transparency, for the time being the Treasury will publish both the old and current net debt measures at the Budget and Half Year Economic and Fiscal Updates.”
-
- We chose the same black and red colour scheme as used on the Government’s own releases. See https://budget.govt.nz/budget/2023/wellbeing/fiscal-strategy/debt-measure.htm#:~:text=The%20Treasury’s%20Budget%20Update%20shows,than%20forecast%20at%20Budget%202021.
- Additional notes from Treasury can be found in the data source pages below.
- All numbers are provisional and subject to revision.
Thank you to the Factors who helped pull this together.
…
SOURCE:
- https://www.treasury.govt.nz/publications/efu/budget-economic-and-fiscal-update-2023 and then Budget Economic and Fiscal Update 2023 – Charts and Data and then go to right to the second to last worksheet called “Time Series Fiscal”
Data published by The Treasury
(c) Crown Copyright
Licensed for use under the creative commons attribution licence (BY) 4.0
…
Did we make a mistake, or have you got smarter data? Let us know.